10 Bearish Candlestick Patterns Every Trader Must Know

In this article, we will explore bearish patterns to learn to predict a possible reversal of the trend and the beginning of a downward movement. Trading using these bearish patterns, along with other strong signals, helps to accurately project price movements and reduce risks, especially amid high volatility.
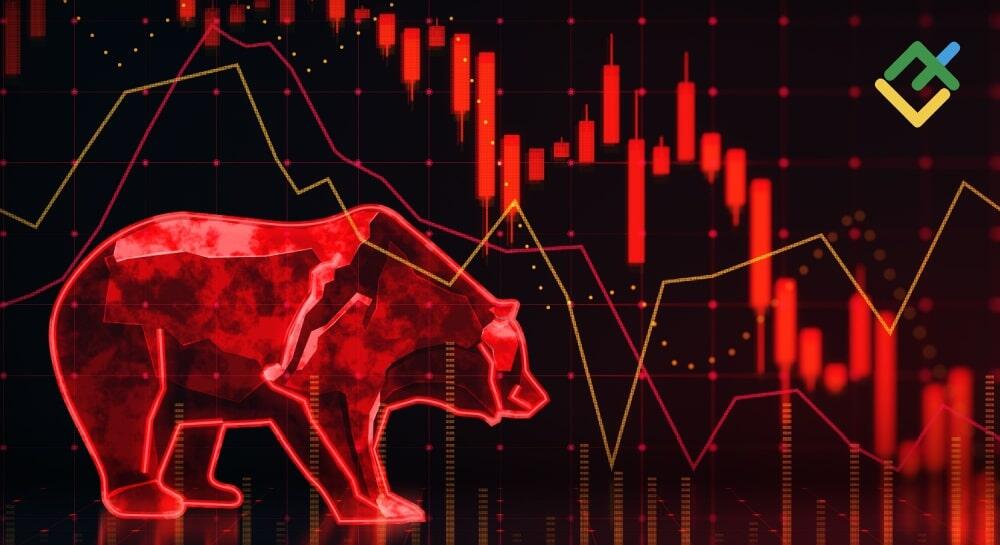
Let’s look at the most popular candlestick patterns that can help you make a good profit when quotes fall.
The article covers the following subjects:
Key Takeaways
- Top bearish candlestick patterns indicate a potential trend reversal and lower prices.
- Bearish chart patterns, such as Gravestone Doji and Tweezer Top, point out changes in market sentiment.
- Proper use of such patterns improves trading results and helps minimize losses.
- Understanding the market situation and using additional trading signals increase the accuracy of forecasts when trading patterns.
What is a Bearish Candlestick Pattern?
A bearish candlestick pattern is a formation that can signal either a reversal of price movement to a downtrend or a continuation of a price decline. It usually forms at trend peaks when buyers lose control, and sellers take over. These patterns indicate growing selling pressure and warn of the beginning of a downward movement. They are helpful in exiting long positions and opening sell trades, especially when supported by confirmation signals.
Bearish chart candlestick patterns can be identified on smaller timeframes in day trading or larger ones when searching for long-term trends.
Best Bearish Candlestick Patterns List
Bearish candlesticks are an essential part of technical analysis. These candlestick patterns usually signal a possible trend reversal. They tend to appear at trend peaks when buyers lose momentum and sellers gain control. These chart patterns highlight increased selling pressure and act as a warning of the start of a downtrend. They can be used for exiting long positions and opening sell trades, especially when technical indicator signals provide additional confirmation.
Hanging Man
The Hanging Man is a bearish candlestick pattern. One of the most recognizable candlestick formations, it signals a shift in market sentiment. It forms at the peak of a continued uptrend. It looks like a red candle with a short body at the top and a long lower shadow, several times longer than the body. The upper shadow is either very short or completely absent, highlighting the weakness of buyers.
The Hanging Man pattern shows that sellers have increased pressure and pushed out buyers, preventing prices from rising further. However, it’s important to wait for confirmation from another bearish candle since the signal can otherwise be false.
Shooting Star
The Shooting Star is a bearish reversal candlestick pattern that appears at the peak of an uptrend and suggests a possible change in market sentiment.
This candlestick has a short body and a long upper wick that is several times the size of the body (visually resembling the Inverted Hammer pattern). This candlestick pattern indicates that buyers tried to push the price higher but faced strong resistance from sellers.
If a bearish candlestick follows the Shooting Star, it confirms the trend reversal signal. Traders often use this pattern to open short positions as it strongly signals the end of the uptrend and weakening momentum.
Bearish Engulfing
The Bearish Engulfing pattern consists of two candlesticks.
The first is a bullish candlestick, showing temporary buyer dominance. The second is a larger bearish engulfing candle that completely engulfs the body of the first. When this pattern is formed, it signals that the sellers have taken control.
It appears at trend peaks, signaling the trend’s completion. Traders often use technical indicators to confirm the signal and to assess the strength of the move (RSI or MACD). The Bearish Engulfing pattern helps spot entry points for short positions and opportunities to lock in profits from long trades, particularly in volatile markets.
Evening Star
The Evening Star is a bearish reversal pattern that consists of three candlesticks. The first is a green (bullish) candlestick, indicating a continuation of the uptrend. The second has a small body and signals slowing growth. The third is a red (bearish) candlestick that closes below the middle of the first candlestick’s body, signaling a trend reversal to the downside.
The Evening Star typically forms at the top of an uptrend, showing weakening buying activity and increasing dominance of sellers. Traders use confirmation signals like trading volumes or resistance levels to validate the pattern.
Tweezer Top
The Tweezer Top pattern consists of two candlesticks—one green and one red—that appear at the peak of a bullish price movement. A key characteristic is the almost identical highs of both candles, signaling strong resistance. The first candle is usually bullish, showing buyers attempting to continue the uptrend. The second candle is bearish, indicating a shift in sentiment and increasing selling pressure.
This pattern is often used to predict a potential downward reversal. It demonstrates that buyers failed to overcome resistance, leaving the sellers in control.
Dark Cloud Cover
The bearish candlestick pattern Dark Cloud Cover is a strong bearish reversal signal. This pattern consists of two candles. The first is a large bullish candle. The second is a bearish candle that opens higher than the previous candle’s close but then closes below the middle of the previous green candle, reflecting a shift in market sentiment.
A Dark Cloud Cover typically forms near resistance levels, where many sell orders accumulate, pushing the price downward.
This pattern signals a decline in buyer interest and an increase in selling activity. It is crucial for identifying key reversal points in a trend. Using support and resistance levels, traders can effectively plan their actions while considering the current market conditions to minimize risks.
Three Black Crows
The Three Black Crows candlestick pattern is made up of three consecutive bearish candles, each opening near the previous candle close and closing at a lower level. This three-candlestick pattern usually appears after a bullish trend and is a sign of an impending shift in market sentiment.
It commonly forms in overbought zones, where buyers lose strength and sellers begin to dominate. Each subsequent candle confirms the trend reversal. A sign of a strong pattern is the presence of very small or no upper shadows on the candles.
Traders often use this pattern to open short positions, especially on higher timeframes. Additional confirmation can be obtained from technical indicators like MACD and RSI, which help identify overbought or oversold conditions.
Shrinking Candles
The Shrinking Candles pattern forms at the peak of a bullish trend and is characterized by a gradual decrease in the size of candle bodies. This signals weakness in the uptrend.
Traders should pay attention to the candles’ positions relative to key levels. The pattern becomes more reliable if trading volumes increase during its formation.
Gravestone Doji
The Gravestone Doji is a bearish candlestick pattern where the opening and closing prices and the low are nearly identical. At the same time, the upper shadow is significantly longer than the candle body. It forms at the top of a bullish trend and indicates buyer weakness and growing seller strength.
When this pattern appears near resistance levels, the likelihood of a downward trend reversal increases. Consider additional factors like trading volumes, technical indicators, and other candlestick patterns for more reliable signals. If the next candle opens below the Gravestone Doji’s close and the price continues downward, the probability of a reversal significantly increases.
Bearish Harami
The Bearish Harami is a reversal pattern made up of two candles. The first is a large bullish candle, reflecting strong growth. The second is a smaller bearish candle, with its body completely contained within the previous candle’s body. This pattern shows weakening buying pressure and can predict a bearish reversal.
Unlike the Bullish Harami, which forms near support, the Bearish Harami forms at the top of the uptrend, near resistance.
To enhance signal accuracy, traders often use additional indicators like trading volume or RSI to assess the strength of the reversal. The appearance of a long bearish candle after the Harami confirms the start of a downward trend. The Bearish Harami is instrumental in analyzing any asset and provides fairly reliable signals for opening short positions.
Bottomline
Every trader should know how to trade bearish candlestick patterns, as they indicate potential reversals driven by strong supply overtaking demand. Among the patterns every trader should know, key formations like Dark Cloud Cover, Evening Star, and Three Black Crows provide valuable signals of market weakness. Recognizing the names of candlestick patterns and their implications helps traders make informed decisions, improving their ability to spot selling opportunities before a downtrend fully develops.
To increase the accuracy of analysis, use bearish candlestick patterns in combination with indicators like RSI or Stochastic to determine the strength of a trend and potential reversal points more accurately. This approach minimizes risks and helps make well-informed trading decisions.
Best Bearish Candlestick Patterns FAQs
The content of this article reflects the author’s opinion and does not necessarily reflect the official position of LiteFinance. The material published on this page is provided for informational purposes only and should not be considered as the provision of investment advice for the purposes of Directive 2004/39/EC.