Three Drives Pattern: A Reliable Reversal Indicator


A Three Drives pattern is one of the key technical analysis tools that helps traders pinpoint price reversals. This harmonic pattern simplifies the prediction of price swings, as it is based on three equal impulses and corrections. The pattern can be used in various trading strategies in currency and stock markets.
The article explains how the pattern works, the rules for using it, and its pros and cons in trading. Using this tool correctly can enhance the accuracy of your trades.
The article covers the following subjects:
Major Takeaways
-
A Three Drives pattern is a harmonic chart pattern built on price symmetry and Fibonacci ratios.
-
The pattern is used to determine price reversal points.
-
It comprises three impulse movements and two corrections.
-
Like most chart patterns, it can be bullish or bearish.
-
This tool is most often used in the stock and Forex markets.
-
The Three Drives pattern signals require confirmation by corrections and Fibonacci retracement levels.
-
The pattern helps to determine entry points accurately and set stop-loss and take-profit orders correctly.
What Is the Three Drives Pattern?
A Three Drives pattern is a chart formation in technical analysis that resembles an ABCD pattern. This pattern reflects the repeating nature of price movements and can be used to anticipate potential reversals. Its core principle is the symmetry between each leg of the move, helping traders gear up for potential trend reversals before they unfold.
How to Identify and Use the Three Drives Reversal Pattern in Forex Trading
The pattern can be easily recognized on a chart. It comprises three waves in one direction, each separated by two corrections. Fibonacci retracements (38.2–61.8%) are used to determine entry points more precisely to build an efficient trading strategy.
Previously Formed Swing Point
This stage is essential for confirming the pattern. Before a Three Drives pattern develops, the market will show signs of a weakening market trend. These signals tend to appear around previously formed swing points, such as key support or resistance levels, where the price has already rebounded in the past.
Divergences on the RSI or MACD, declining volume, and candlestick reversal patterns can serve as additional signals. These factors increase the likelihood of a reversal during the pattern’s third drive. Besides, traders often rely on historical levels and Price Action signals to identify entry points.
Fibonacci Extensions & Retracements
In the Three Drives pattern, Fibonacci retracement levels help identify correction zones and potential price targets. Typically, each retracement falls between 38.2% and 61.8% before the trend resumes, driving the price to new lows or highs.
Each subsequent Fibonacci extension level is larger than the previous one: 78.6%, 100%, and 161.8%. A price reversal between 100% and 161.8% can mark a prime zone for entering trades. However, the reversal should be confirmed by volume or other indicators to improve the accuracy of the setup. What matters most is not the exact Fibonacci level but the way the price behaves when it reaches these zones. Therefore, it is better to wait for a clear reversal signal when the price tests these key areas.
Bullish Three Drives
A Bullish Three Drives pattern appears in a downtrend and signals a potential upward reversal. In this setup, the price reaches three consecutive lows, each separated by a corrective pullback.
When the last leg of a Bullish Three Drives pattern forms, the trend typically decelerates, volume declines, and indicators such as the RSI confirm the reversal. The end of the third leg often coincides with a key support level. Once the reversal is confirmed, traders look for long entry opportunities and place a stop-loss order at the previous low.
Bearish Three Drives
A Bearish Three Drives pattern occurs in an uptrend and indicates an imminent downward reversal. The price forms three consecutive higher highs, each followed by a correction.
As the final impulse forms, volume typically drops and indicators begin flashing confirmation signals, pointing to a weakening trend. The second pullback often ends at a key level (100% in the example below), and when the next extension (161.8%) is reached, the trend usually changes. Once the reversal is confirmed, traders initiate short positions and place a stop-loss order just above the previous high.
How to Trade Forex Using the Three Drives Formation
Following clear rules for entries, stop-losses, and profit targets is key to trading success. A Three Drives pattern works best when confirmed by Fibonacci retracements and other indicators. This combination helps predict reversals more accurately and manage risk more effectively.
1. Market Entry
Yoy can enter the market once you receive a confirmation signal and the third drive is complete. These signals include key resistance or support levels, candlestick reversal patterns such as a Pin Bar or an Engulfing, or the RSI or MACD indicators. A decrease in trading volume serves as additional confirmation. Notably, it is important to wait for a clear signal to avoid a false breakout.
2. Stop-loss
To avoid a premature exit, a stop-loss order should be placed at the level of the third drive or beyond. For a bearish pattern, the stop-loss order is set above the last high. For a bullish pattern, it is set below the most recent low. If necessary, adjust it using market volatility, measured by the ATR indicator. This will help you maintain your position during sharp price fluctuations.
3. Profit Targets
Profit targets are determined using Fibonacci levels, as well as key resistance and support levels.
-
The first target is the correction levels of 38.2% or 61.8% retracement of the entire pattern if the price moves in the direction of the reversal. These are areas where short-lived pullbacks often occur.
-
The second target is the nearest support or resistance level where strong reversals often occur.
Experienced traders use partial profit-taking, closing part of the trade at the first target and the rest at the second if the trend continues in the same direction.
Example
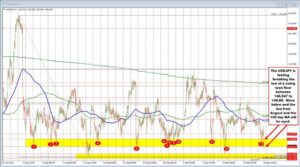
On the daily chart, the GBPUSD pair has formed a bearish Three Drives pattern, suggesting a possible downward reversal. The price failed to reach the 161.8% level, which means that entering a trade may be complicated. In such cases, it is important to use additional signals confirming the weakening of the bullish momentum.
One of them was a candlestick with a small body and long shadows, similar to Doji (4), but with a predominance of bearish volume. Such a candlestick indicates market indecision: buyers can no longer sustain the upward impulse, and sellers are gaining strength. This increased the likelihood of a reversal, especially in combination with a bearish MACD crossover (5), where the MACD line crossed the signal line from above.
Trade setup:
-
Enter a trade at around 1.33200 after MACD confirms a reversal.
-
A stop-loss is set beyond the third drive at 1.34150 to avoid a false breakout.
-
A take-profit order is placed at 1.30000, which coincides with the support zone and the 100% Fibonacci retracement level.
After entering the market, the price began to decline, following the pattern. With the combination of Fibonacci, MACD, and candlestick patterns, a premature entry was avoided, and the strength of the reversal was confirmed. The trade was closed with a profit at 1.30000, providing an optimal risk-to-reward ratio.
Pattern Variations: 1-2-3 Pattern, Three Indians, Three Touches, Three Mountains, Three Rivers
The classic Three Drives reversal pattern consists of a series of three key points. The first point marks the beginning of the correction, the second one signals an attempt to resume the trend, and the third point triggers the final reversal movement.
-
Pros: It is easy to identify and works well on all time frames.
-
Cons: It can generate false signals without additional confirmation by volumes and candlestick patterns.
Three Indians
The Three Indians pattern is a close cousin of the drive 3, consisting of three consecutive highs in an uptrend or lows in a downtrend. It is different because each subsequent drive is shorter than the previous one.
Three Touches
The Three Touches pattern is characterized by the price testing the support or resistance level three times but failing to break through it, which signals a possible reversal.
Three Mountains
The Three Mountains pattern looks like three consecutive peaks, similar to the Head and Shoulders pattern, but its central peak is lower than the third one.
Three Rivers
The Three Rivers pattern is the opposite of the Three Mountains. It consists of three consecutive lows and indicates a possible upward reversal.
Three Drives Harmonic Patterns – Pros and Cons
The Three Drives pattern is a key tool for harmonic trading. It uses symmetry and Fibonacci ratios to indicate market reversals. Like any chart pattern, it has advantages and disadvantages.
Advantages:
-
Signal accuracy. With correct signal interpretation, the probability of a successful trade is high.
-
Applicability in different markets. It is applicable not only to the Forex market, but also to stocks, cryptocurrencies, and commodity assets.
-
Structure. There are clear rules for entry, stop-loss management, and profit-taking.
-
Compatibility with other tools. It can be effectively combined with Fibonacci levels, candlestick patterns, and indicators.
Disadvantages:
-
Difficulty of identification. It requires technical analysis skills and experience.
-
Frequent false signals. Without confirming factors, entry may be premature.
-
Dependence on market conditions. It is not useful in flat or highly volatile markets.
-
Does not always provide accurate reversal levels. Without additional indicators, it is difficult to determine the completion of the third drive.
Conclusion
The Three Drives pattern is one of the most reliable reversal patterns. Based on Fibonacci ratios and the principle of symmetry, it is predictable and trade-friendly. Correctly identifying correction and extension levels helps traders find accurate entry points and minimize risk.
Although this harmonic pattern can be applied to different markets, it requires confirmation with indicators and other technical analysis tools. To use the pattern effectively, it is important to understand its structure, consider market conditions, and establish clear rules for entry, stop-loss, and profit-taking.
Three Drives Pattern FAQs
The content of this article reflects the author’s opinion and does not necessarily reflect the official position of LiteFinance broker. The material published on this page is provided for informational purposes only and should not be considered as the provision of investment advice for the purposes of Directive 2014/65/EU.
According to copyright law, this article is considered intellectual property, which includes a prohibition on copying and distributing it without consent.