Decoding Three Inside Up/Down Candlestick Pattern

Japanese candlestick patterns are among the most widely used tools in technical analysis, and those formed by three or more candles are generally considered the most reliable. The Three Inside Up and Three Inside Down patterns are prime examples that fall into this category.
These chart patterns work best on higher time frames, with the potential to yield gains of up to 10–12% on your deposit. Explore how to use these triple candlestick patterns effectively in Forex trading.
The article covers the following subjects:
Major Takeaways
|
What is the Three Inside Up/Down candlestick pattern? |
The Three Inside Up/Down is a candlestick pattern that shows up after an uptrend or downtrend, indicating a change in market sentiment and potential price reversal. |
|
What is the difference between Three Inside Up and Three Inside Down? |
The Three Inside Down pattern forms after an uptrend, while the Three Inside Up pattern emerges after a downtrend. |
|
How does the pattern affect the market? |
The Three Inside formation is a reversal pattern that emerges at the end of a trend, offering traders a chance to enter in the new direction. |
|
How does the pattern work? |
A trader places a pending order to open a short or long position at the level of the third candle’s close. Once the order is triggered, the trade opens automatically. |
|
How to identify the pattern on a chart? |
The pattern consists of three candles. The first candle has a large body, while the second one is smaller and contained entirely within the first candle, similar to the Harami pattern. The third confirming candle closes beyond the first candle’s open, providing the entry signal. |
|
Relevance of the pattern |
The pattern is relatively easy to identify on a candlestick chart, especially if you know the principles of the Harami pattern formation. Moreover, the pattern is commonly used in various financial markets. |
|
Advantages of the Three Inside Up/Down pattern |
The pattern has a simple structure, can be found on any time frame, and often signals the start of profit-taking in existing long or short positions. |
|
Disadvantages of the Three Inside Up/Down pattern |
It appears quite rarely on the chart, resembles other patterns, lacks clear profit-taking levels, and requires opening trades at market price. |
|
Suitable time frames |
The pattern can be used on any time frame. However, as with most patterns, it is more reliable on higher time frames. |
|
Stop order levels |
Stop-loss and take-profit orders are set once the third candlestick closes and a trade is opened. |
What is the Three Inside Up/Down Candlestick Pattern?
The Three Inside Up/Down pattern is a sequence of three candlesticks formed at the end of a steady trend, signaling an imminent trend reversal.
Meaning and Origin of the Three Inside Up/Down Pattern
Like many candlestick patterns, the Three Inside Up/Down develops in stages, with each stage reflecting a different pattern that evolves as the trend unfolds.
This pattern signals a potential trend reversal, indicating that momentum is slowing. Once the pattern is complete, the price often breaks through the support or resistance level of the previous trend, which traders perceive as a signal to open positions.
The first two candles are key to identifying the pattern. If they form a Harami, there is a strong chance that a Three Inside Up/Down pattern will develop. Since the Harami itself is a reversal pattern, its transformation into a Three Inside Up/Down only strengthens the signal.
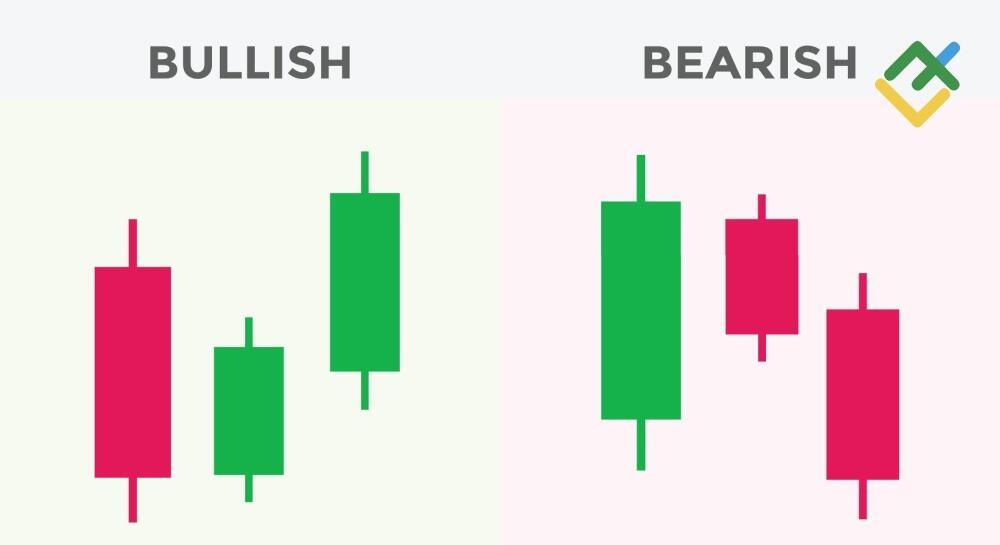
Bullish vs Bearish: Three Inside Up vs Three Inside Down
The Three Inside Up is a bullish reversal pattern that forms during a downtrend. Its appearance signals that sellers are losing momentum while buyers begin to take control.
Three Inside Up
The Three Inside Up pattern begins with a long bearish candle that continues the downtrend. It is followed by a smaller bullish candle that forms within the range of the first one, creating a Harami pattern. The third bullish candle provides a confirmation signal, often accompanied by high trading volume that indicates a gradual rise in bullish interest. At this stage, bears recognize their weakness, close positions, or switch sides, while bulls gain control. The formation results in a bullish candle that closes above the open and body of the first one, signaling a bullish reversal.
Three Inside Down
The Three Inside Down pattern appears in a bullish trend. Once traders spot this bearish pattern on a chart, they realize that bulls can no longer push the price higher and bears are starting to take over the market.
The Three Inside Down pattern starts with a long bullish candle that represents a continuation of the present uptrend. It is followed by a smaller bearish candle that forms within the previous candle’s range, also establishing a Harami pattern. The third bearish candle confirms the reversal, as buying volume is gradually absorbed and bulls can no longer support the price growth. At this point, buyers exit their trades or switch sides, allowing sellers to gain control. The result is a bearish candle that closes below the open of the first bullish candle, signaling a shift from an uptrend to a downtrend.
Why Is It Important for Traders?
This pattern is essential for traders because it can act as a confirmation tool for reversal signals within broader trading systems. It is most commonly used in the stock market, where it often confirms reversals in strategies based on breakouts of support and resistance levels.
When the Three Inside Up candlestick pattern is used to confirm a breakout of support or resistance, experienced traders often analyze multiple time frames. The structure of the pattern is unique in that it may appear as different patterns depending on the chart. For example, a completed Inside Up/Down pattern on the H4 chart may look like a Morning Star or Evening Star on the D1 chart.
How is the Three Inside Up/Down Pattern Formed?
The pattern consists of three candlesticks, each representing a stage in its formation. Let’s break down these stages using the Three Inside Up bullish pattern as an example.
Step-by-Step Formation Explained
- First candle. A pronounced bearish trend ends with a large black candle, which may have a long lower shadow, indicating the beginning of a battle between bulls and bears.
- Second candle. Once the first candle closes, the price jumps, and the second candle opens higher than the close of the first one. It has a small body that is contained within the body of the first one. These first two candles form a bullish Harami pattern.
- Third candle: In this stage, a large bullish candle forms, showing clear bullish momentum and breaking above the high of the previous candle. It closes above the opening price of the first candle, confirming an upward breakout. Together, the three candles complete the Three Inside Up pattern.
The Role of Candle Colors and Sizes
Each candle plays a significant role in the structure of the pattern. To identify it correctly, remember that the first candle must always be a different color from the next two. If the first candle is black, the following two should be white, forming the Three Inside Up. If the first candle is white, the next two should be black, creating the Three Inside Down.
Moreover, the size of candles matters. The strength of the pattern is often assessed based on the second candle. If its body is at least three times smaller than that of the first candle and a Harami pattern has formed, this is the most reliable signal for a reversal.
Time Frames Where It Appears Most Often
As a rule, candlestick patterns are traded on the same time frame where they were detected. However, the Three Inside Up/Down pattern is an exception because when you switch from a lower to a higher time frame, it may appear as a single candlestick, which reinforces the reversal signal.
For this reason, traders often use two time frames together when trading this pattern. The most common approach is to combine the H4 and D1 charts. On H4, one trading day is shown as four candlesticks, which merge into a single one on the D1 chart.
Market Conditions Where It Is Most Reliable
For the entry signal to be reliable, the pattern should appear at the end of a clear bullish or bearish trend, not in the middle of movement or within a sideways market. When it forms under the right conditions, it signals a potential reversal and the completion of the prior trend. If the pattern is identified incorrectly, false signals may occur.
How to Trade Using the Three Inside Up/Down Pattern
The pattern is not often employed in standalone trading strategies, so there are only two popular ways to trade it. You can use the strategy, where traders enter when the third candle closes beyond the first candle’s open, or the overbought and oversold reversal strategy, where the pattern is utilized in combination with the RSI.
Entry and Exit Three Inside Up/Down Strategies
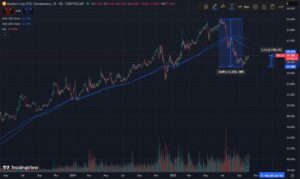
The most common way to trade this pattern is on a breakout of the first candle. Traders decide to enter the market in two steps. The chart above shows an example of opening a short trade based on the Three Inside Down signal.
In the first step, a trader waits for the third candle to start forming and watches whether it drops below the open of the first candle. If so, a trader then waits for the third candle to fully close. Once it closes below the open of the first candle, a trader initiates a short position, aiming to capitalize on a new downward trend.
Risk Management and Stop Loss Placement
A stop-loss order should only be set after a short or long trade is opened. If the pattern is bearish, a stop-loss order should be placed at or slightly above the open of the first candle. In a bullish setup, a stop-loss order should be set at or below the open of the first candle to manage risk.
Setting a take-profit order with this pattern can be challenging since it does not provide clear profit targets. A common approach is to place a take-profit order around the level where the previous upward movement began. A more conservative option is to set the take-profit at roughly half of that distance. Another option is to apply a trailing stop, moving your stop-loss order to the breakeven level once the price covers the pattern’s range.
Confirmation Indicators to Use
Another popular method to trade the pattern is to combine it with additional technical indicators, such as oscillators. The most effective way is to use the pattern in conjunction with the RSI, although other indicators can be added.
The RSI can be used to confirm entry and exit points. A short trade can be opened when the third bearish candle closes below the open of the first candle and the RSI value leaves the overbought zone. A long trade can be initiated when the third bullish candle closes above the open of the first one and the indicator exits the oversold zone.
Best Markets and Time Frames
As mentioned earlier, the Three Inside Up/Down pattern can be applied to any financial market. However, to improve your trading performance, you need to consider the following rules.
- Trade only in highly liquid markets. In less liquid markets, such as the stock market, price gaps occur almost daily. These gaps reduce the reliability of the pattern and make trading signals less accurate.
- Do not trade volatile instruments. The best option for trading this pattern is the Forex market, as it provides the proper balance of liquidity and volatility. Nevertheless, avoid periods of strong market fluctuations.
- When choosing a time frame, consider both market noise and proper money management. On lower time frames, the pattern often produces false signals due to higher market noise. On higher time frames, trades often require longer holding periods. Besides, you need to factor in commissions and swaps. The H4 time frame is the most effective, as it provides clearer signals while still allowing traders to open and close positions within the same day.
Advantages and Disadvantages of the Pattern
Like many candlestick formations, the Three Inside Up/Down pattern is used to confirm potential market reversals, and it comes with its own strengths and limitations:
Strengths of the Three Inside Up/Down
- A clear signal. The pattern is easy to spot on the chart, straightforward to interpret, and often does not require additional confirmation.
- Derived from another pattern. The Three Inside pattern often develops from a Harami formation, which reinforces the reversal signal.
- Predetermined levels. Entry and stop-loss levels are easy to identify and can be set as soon as the pattern forms.
- Works on different time frames. The pattern can appear on any time frame, making it suitable for various types of trading, from intraday to long-term.
- Appears in different markets. The pattern occurs in any market, from currency and cryptocurrency to the stock and derivatives markets.
Limitations and When It Fails
- May give delayed signals. The first two candles may already hint at a reversal, and by the time the third one confirms it, the reversal may be underway, leaving little room to enter.
- The importance of a strong trend. This pattern is most reliable in a strong market trend. When it appears during sideways movement, the signal can be weak or false.
- Heavy dependence on volatility. The pattern only works well in a calm market. When the market is highly volatile, its signals are often false.
- An ideal pattern is rare. In most cases, the market forms variations of the pattern or signals that appear too late, which often reduces their effectiveness.
How Accurate Is It Compared to Other Patterns?
Although the perfect setup is rare, even variations of this pattern often provide reliable signals and profitable opportunities. It is advisable to test the pattern on the H4 and D1 time frames. On H4, the pattern shows about 81% winning trades, and 89% of those reach the predetermined take-profit target. On D1, the signals are even stronger, with around 90% of trades ending in profit, and 95% of them hitting the take-profit level.
Compared to other candlestick patterns, its accuracy is inferior only to the Falling Three Methods and some indecision candles.
What do the Three Inside Up and Down Patterns Indicate in Terms of Market Sentiment?
Each candlestick pattern is preceded by a specific market context. The pattern either completes or continues it. For the Three Inside Up/Down, a clear trend must be present, and the pattern usually marks its turning point.
The pattern reflects a battle between buyers and sellers, which ends with the ultimate victory of one side. In a bullish setup, sellers initially dominate. The first large black candle shows the strength of the downtrend. After it closes, some sellers take profits, which leads to the formation of a small white candle. Together, the first two candles often create a Harami pattern, hinting at a possible reversal. When the third candle appears, sellers lose confidence and start to retreat. As this candle breaks above the first one, bears exit quickly, driving the price higher.
Three Inside Up/Down vs Other Candlestick Patterns
Inexperienced traders often confuse this pattern with others that are very similar to the Three Inside Up/Down. Although these patterns work in the same way, it is crucial to understand their differences. Let’s examine the most common patterns that can resemble the Three Inside Up/Down.
Difference Between Three Inside and Three Outside
The Three Inside Up/Down pattern is most similar to the Three Outside Up/Down. Both consist of three candlesticks, and the only difference is how the first two candles form.
In the case of the Three Inside Up candlestick pattern, the first candle is always larger than the second one, and the pattern they form often resembles a Harami pattern. When it comes to the Three Outside Up pattern, the first candle is always smaller than the second one, and the pattern they form resembles a standard Bullish Engulfing.
Despite different structures, patterns form in almost the same way and are traded using similar principles. Therefore, even if you confuse them, the final result will hardly be affected.
How It Compares to Engulfing and Harami
Other similar formations are the Engulfing and Harami patterns. In fact, both of these patterns represent the first stage of the Three Inside Up/Down and Three Outside Up/Down patterns.
In a Bullish Engulfing, the first candle is smaller than the second, and the second candle’s body completely engulfs the first candle. This is essentially the first stage of the Three Outside Up pattern. The Harami pattern, which was already discussed in the article, works similarly. The Bullish Harami represents the first stage of the Three Inside Up pattern.
Therefore, the Engulfing and Harami patterns signal the beginning of the Three Inside Up/Down formation. When they appear, traders should be prepared for the main pattern to emerge.
Is It a Type of Doji Pattern?
In essence, many patterns can appear as variations of one another. However, the Three Inside Up/Down and Doji candles are quite different, sharing almost nothing in common.
A Doji is a single candlestick that reflects the battle between buyers and sellers, often ending in a stalemate. With the Three Inside pattern, however, the outcome is never neutral, as one side always comes out on top.
Real Market Examples of Three Inside Up/Down Patterns
As noted earlier, the Three Inside Up/Down is a strong candlestick reversal pattern. Once it forms, the new trend can be long-lasting and robust. Let’s look at an example where the pattern develops into an entire trend on its own.
On the daily NZDUSD chart above, the uptrend is fueled by three such patterns. They not only mark the start of the upward market movement but also help sustain the trend as it develops.
The chart shows that there is a strong downtrend consisting of numerous black candles preceding the first Three Inside Up pattern. Eventually, the pattern reverses the trend upwards.
When using this pattern, traders have several approaches to choose from. They can open short-term trades on lower time frames, use a trailing stop to lock in profits, or trade with the trend using a scaling-in strategy. For this pattern, scaling in is often the most effective. By adding new positions each time the pattern appears (without closing the existing ones), a trader can ride the trend and end up holding multiple profitable trades. On the D1 time frame, this approach can deliver substantial returns.
Conclusion
The Three Inside reversal pattern is a powerful tool that helps traders spot when to enter a new trade ahead of a trend change and when to exit the previous one. In some cases, the Three Inside Up/Down can even serve as the foundation of a standalone trading system capable of generating consistent profits.
However, it is important to remember that no candlestick pattern provides a completely reliable signal. Their effectiveness depends on following clear rules that fit a trader’s style. In the end, the profitability of any strategy comes down to combining all elements of the plan correctly and applying proper risk management.
Three Inside Up and Down Patterns FAQ
The content of this article reflects the author’s opinion and does not necessarily reflect the official position of LiteFinance broker. The material published on this page is provided for informational purposes only and should not be considered as the provision of investment advice for the purposes of Directive 2014/65/EU.
According to copyright law, this article is considered intellectual property, which includes a prohibition on copying and distributing it without consent.