Intel Stock Forecast & Predictions for 2025, 2026, 2027–2030, 2040 and Beyond


Intel Corp. shares have historically served as a reliable benchmark for technological advancement and a key gauge of the semiconductor industry’s performance. Forecasting their long-term value entails a multifaceted analysis that encompasses a wide range of factors, including the geopolitical landscape, competitive pressures from industry leaders such as AMD and NVIDIA, advancements in processor technologies, and the emergence of new market niches.
This article analyzes Intel’s prospects for the 2025–2050 time frame, considering possible market scenarios, technology trends, and the company’s financial position to provide balanced and well-informed forecasts.
The article covers the following subjects:
Major Takeaways
- The current price of INTC is $23.59 as of 18.02.2025.
- The INTC price reached its all-time high of $74.88 on 2000-08-31. The stock’s all-time low of $0.22 was recorded on 1982-01-13.
- Analysts agree that Intel Corp. shares will embark on a downward trajectory in 2025. However, they offer different bearish targets. According to the most pessimistic forecasts, the asset’s value may fall to $15.71–$16.76 by the end of 2025. More moderate estimates point to a decline to $18.40.
- In 2026, the bearish trend will likely reverse, and the price will start recovering. According to forecasts, the share price of Intel Corp. may rise to $28.05 by the end of 2026. However, several analysts suggest that INTC quotes will decline to $10.03.
- Analysts anticipate that the trading instrument will showcase mixed performance between 2027 and 2030. Some industry experts predict that the price will soar to $37.10–$42.06 by 2030. Other experts believe that the INTC rate will slump to $3.18–$13.55.
- Long-term forecasts for Intel Corp. shares from 2040 to 2050 show a wide range of estimates. Some experts predict a price increase to $2,700.00 by 2050, while others anticipate a price of $16.20.
Intel (INTC) Real-Time Market Status
The INTC stock is trading at $23.59 as of 18.02.2025.
It is imperative for investors to monitor the following key metrics of the Intel Inc. stock to ensure profitable investing:
- Market capitalization indicates Intel’s net worth in the market.
- Shares outstanding reflect the total number of shares of the company’s stock in the market.
- Earnings per share (EPS) is the portion of a company’s earnings that is allocated to each individual share.
- The price-to-earnings (P/E) ratio shows how expensive a stock is relative to earnings.
- Monthly volatility refers to the 30-day change in the asset’s price.
- Average trading volume (20-day) displays the average daily trading volume over the last 20 trading sessions.
| Metric | Value |
| Market capitalization | $82.70 billion |
| Shares outstanding | 4.33 billion |
| Earnings per share (EPS) | -4.38 |
| Price-to-earnings (P/E) ratio | N/A |
| Volatility (30-day) | 40.47% |
| Average trading volume (20-day) | $74.05 million |
Intel (INTC) Stock Price Forecast for 2025 Based on Technical Analysis
Let’s conduct a technical analysis of the Intel stock on the weekly time frame to make a forecast for 2025.
Since the beginning of August 2024, Intel quotes have been forming a large Descending Triangle chart pattern. The price is expected to violate the lower boundary of this pattern and continue to decline shortly. The INTC rate is currently trading around $19.09. Notably, Inverted Hammer and Hammer reversal candlestick patterns emerged near the key support level of $17.94, signaling that bulls are gaining traction in the market. A Doji candlestick pattern points to uncertainty. However, a previous bearish candlestick indicates that bearish pressure persists.
Technical indicators do not provide clear buy or sell signals. The MACD is declining towards the zero threshold, and the MFI values are also declining, indicating a liquidity outflow. The tick volume is low, suggesting a lack of trading activity and reflecting waning bullish momentum. The asset’s price is trading below the MA50 and MA200, which are at $27.10 and $37.62, respectively. Nevertheless, the stochastic oscillator points to an oversold condition in the market, suggesting that the price may rebound to the upside.
Despite the fact that technical indicators and candlestick patterns generate mixed signals, bears are likely to push the price below the lower boundary of the Descending Triangle pattern at $17.94 quite soon. If the stock price settles below this threshold on increased trading volume on the trading instrument, it will likely plunge to the area of $15.08–$7.11.
An alternative scenario suggests that bulls manage to regain lost ground and drag the price above the key resistance level of $25.65 on increased trading volume. In this case, the downtrend will reverse, and the price will surge to the area of $30.87–$51.10.
The following table provides an overview of trading instrument’s projected highs and lows for the next 12 months.
|
Month |
Intel (#INTC) Stock Projected Values | |
| Minimum, $ | Maximum, $ | |
| February 2025 | 17.48 | 20.98 |
| March 2025 | 15.94 | 19.34 |
| April 2025 | 14.60 | 16.97 |
| May 2025 | 14.19 | 17.69 |
| June 2025 | 15.12 | 18.41 |
| July 2025 | 12.24 | 15.84 |
| August 2025 | 11.72 | 15.12 |
| September 2025 | 11.93 | 15.73 |
| October 2025 | 8.53 | 12.44 |
| November 2025 | 6.48 | 9.25 |
| December 2025 | 6.27 | 11.52 |
| January 2026 | 7.61 | 12.65 |
Long-Term Trading Plan for INTC
The technical indicators and candlestick patterns are providing divergent signals regarding the potential future trajectory of Intel’s stock price. However, key support and resistance levels can be employed in a trading strategy designed for the year.
Yearly Trading Plan
- The Inverted Hammer and Hammer candlestick patterns appeared within the Descending Triangle chart pattern, suggesting that the price may exhibit an upward reversal. However, the Doji candlestick pattern suggests that investors should exercise caution, as it indicates significant market uncertainty.
- The technical indicators are providing mixed signals. MACD is declining in the positive zone, the stochastic indicator is in the oversold zone, and the MFI is dropping, indicating a liquidity outflow. In general, the technical indicators suggest a bearish outlook for the asset.
- If the INTC stock price breaches the Descending Triangle pattern’s lower boundary, the bearish trend will likely persist, and the quotes will slide to $7.11.
- However, if bulls gain the upper hand and push the price above $25.65, one may consider long positions with targets in the range of $30.87–$51.10.
Analysts’ Intel (INTC) Shares Price Projections for 2025
Analysts predict that the INTC stock will decline in 2025.
LongForecast
Price range in 2025: $11.44–$20.42 (as of 10.02.2025).
According to LongForecast, the Intel stock may reach $12.90 by midyear. Analysts expect a bullish reversal and a recovery of the trading instrument’s quotes to the area of $15.71 by the end of December.
| Month | Open, $ | Min–Max, $ | Close, $ |
| February | 19.43 | 15.35–20.42 | 16.98 |
| March | 16.98 | 13.89–19.77 | 15.10 |
| April | 15.10 | 13.46–15.80 | 14.63 |
| May | 14.63 | 11.44–14.63 | 12.44 |
| June | 12.44 | 11.87–13.93 | 12.90 |
| July | 12.90 | 12.13–14.25 | 13.19 |
| August | 13.19 | 12.49–14.67 | 13.58 |
| September | 13.58 | 13.21–15.51 | 14.36 |
| October | 14.36 | 13.71–16.09 | 14.90 |
| November | 14.90 | 13.93–16.35 | 15.14 |
| December | 15.14 | 14.45–16.97 | 15.71 |
CoinCodex
Price range in 2025: $15.95–$21.50 (as of 10.02.2025).
CoinCodex anticipates a more moderate decline in Intel shares throughout 2025. By the middle of the year, the asset’s quotes may plunge to $18.18. In the second half of the year, the bearish trend will prevail, and the price may reach $16.76 by the end of December.
| Month | Minimum, $ | Average, $ | Maximum, $ |
| February | 18.30 | 19.57 | 20.11 |
| March | 19.94 | 20.63 | 21.33 |
| April | 17.74 | 19.60 | 21.50 |
| May | 17.64 | 18.30 | 18.66 |
| June | 17.17 | 18.18 | 18.70 |
| July | 16.50 | 16.98 | 18.16 |
| August | 16.67 | 17.08 | 17.64 |
| September | 16.63 | 17.31 | 17.77 |
| October | 15.95 | 17.02 | 18.12 |
| November | 16.21 | 16.52 | 16.89 |
| December | 16.40 | 16.76 | 17.27 |
Gov Capital
Price range in 2025: $15.84–$21.29 (as of 10.02.2025).
According to the Gov Capital portal, the average price of Intel stock is expected to remain within the range of $18.38 to $19.35 by June 2025. Between July and December, INTC quotes are projected to continue declining to $17.68. However, the price is expected to stabilize at $18.40 by the year-end.
| Date | Least price possible, $ | Average price, $ | Best price possible, $ |
| 28.02.2025 | 17.42 | 19.35 | 21.29 |
| 31.03.2025 | 16.76 | 18.63 | 20.49 |
| 30.04.2025 | 16.60 | 18.45 | 20.29 |
| 31.05.2025 | 16.54 | 18.38 | 20.21 |
| 30.06.2025 | 16.96 | 18.84 | 20.73 |
| 31.07.2025 | 16.80 | 18.67 | 20.54 |
| 31.08.2025 | 16.12 | 17.91 | 19.70 |
| 30.09.2025 | 15.91 | 17.68 | 19.45 |
| 31.10.2025 | 15.84 | 17.60 | 19.36 |
| 30.11.2025 | 16.31 | 18.12 | 19.94 |
| 31.12.2025 | 16.56 | 18.40 | 20.24 |
The 2025 stock outlook for Intel Corp. offers a mixed picture. Analysts’ predictions are all over the map due to several factors, such as fierce competition, technological challenges, and a shifting macroeconomic environment. While some experts are optimistic about growth potential driven by new products and markets, most predictions are cautiously pessimistic, anticipating stagnation or even decline due to production and market share issues. The consensus among experts is to maintain a cautious stance and hold the company’s shares in their portfolios.
Analysts’ Intel (INTC) Shares Price Projections for 2026
Experts have differing views on Intel’s share price in 2026.
LongForecast
Price range in 2026: $14.68–$30.29 (as of 10.02.2025).
LongForecast expects that the value of the tech giant’s securities will drop to $15.71 by the beginning of 2026. However, the forecast is bullish, mirroring growth to $23.11 by the middle of the year and $28.05 by the year-end.
| Month | Open, $ | Min–Max, $ | Close, $ |
| January | 15.71 | 14.68–17.24 | 15.96 |
| February | 15.96 | 14.84–17.42 | 16.13 |
| March | 16.13 | 15.35–18.01 | 16.68 |
| April | 16.68 | 16.68–20.69 | 19.16 |
| May | 19.16 | 19.16–23.79 | 22.03 |
| June | 22.03 | 21.26–24.96 | 23.11 |
| July | 23.11 | 20.64–24.24 | 22.44 |
| August | 22.44 | 21.11–24.79 | 22.95 |
| September | 22.95 | 22.60–26.54 | 24.57 |
| October | 24.57 | 24.12–28.32 | 26.22 |
| November | 26.22 | 25.15–29.53 | 27.34 |
| December | 27.34 | 25.81–30.29 | 28.05 |
CoinCodex
Price range in 2026: $9.20–$18.13 (as of 10.02.2025).
According to the experts at CoinCodex, INTC quotes may reach $17.35 at the beginning of 2026. By the end of June, the price may collapse to $13.59. In the second half of the year, the downtrend will likely persist, and the average price may reach the level of $10.03.
| Month | Minimum, $ | Average, $ | Maximum, $ |
| January | 15.69 | 17.35 | 18.13 |
| February | 14.99 | 15.80 | 16.32 |
| March | 14.89 | 15.87 | 17.01 |
| April | 15.24 | 15.78 | 17.02 |
| May | 14.00 | 14.59 | 15.22 |
| June | 12.78 | 13.59 | 14.85 |
| July | 12.50 | 13.06 | 13.63 |
| August | 11.47 | 12.18 | 12.67 |
| September | 9.76 | 10.55 | 11.36 |
| October | 9.20 | 9.62 | 9.89 |
| November | 9.96 | 10.36 | 10.87 |
| December | 9.43 | 10.03 | 10.63 |
Panda Forecast
Price range in 2026: $18.89–$21.79 (as of 10.02.2025).
According to the analytical agency Panda Forecast, the average price of the asset is projected to stand at $19.21 by the beginning of 2026. In the first half of the year, the price will likely show a mixed trend, with a closing price of $20.30 by the end of June. The second half of the year will also be characterized by moderate shifts, with an average price of $19.68 in December.
| Month | Minimum, $ | Average, $ | Maximum, $ |
| January | 18.93 | 19.21 | 19.58 |
| February | 18.89 | 19.63 | 20.26 |
| March | 19.79 | 20.13 | 20.84 |
| April | 19.23 | 19.75 | 20.02 |
| May | 19.01 | 19.79 | 20.55 |
| June | 19.55 | 20.30 | 20.70 |
| July | 19.79 | 20.47 | 21.25 |
| August | 20.00 | 20.72 | 21.11 |
| September | 20.34 | 20.90 | 21.39 |
| October | 20.67 | 20.98 | 21.79 |
| November | 19.29 | 20.09 | 20.51 |
| December | 19.12 | 19.68 | 20.03 |
The outlook for Intel Corp. stock in 2026 is mixed. Market analysts predict growth due to new technologies and increased demand, as well as a possible decline due to competition and geopolitical risks. Investors should closely monitor the company’s financials and the overall economic situation.
Analysts’ Intel (INTC) Shares Price Projections for 2027
Most industry experts project that Intel’s stock price will rise in 2027. However, a number of analysts hold a different view.
LongForecast
Price range in 2027: $25.52–$39.57 (as of 10.02.2025).
LongForecast anticipates the INTC stock to show moderate growth in 2027. At the beginning of the year, experts project a price of $28.05. By the end of June, the closing price is predicted to edge higher to $30.18, with a projected yearly high of $39.57. By the end of the year, INTC quotes are likely to stabilize at $30.06.
| Month | Open, $ | Min–Max, $ | Close, $ |
| January | 28.05 | 25.52–29.96 | 27.74 |
| February | 27.74 | 26.47–31.07 | 28.77 |
| March | 28.77 | 28.77–34.41 | 31.86 |
| April | 31.86 | 31.86–39.57 | 36.64 |
| May | 36.64 | 32.67–38.35 | 35.51 |
| June | 35.51 | 27.77–35.51 | 30.18 |
| July | 30.18 | 28.79–33.79 | 31.29 |
| August | 31.29 | 29.43–34.55 | 31.99 |
| September | 31.99 | 30.30–35.56 | 32.93 |
| October | 32.93 | 32.03–37.59 | 34.81 |
| November | 34.81 | 27.22–34.81 | 29.59 |
| December | 29.59 | 27.66–32.46 | 30.06 |
CoinCodex
Price range in 2027: $9.18–$16.66 (as of 10.02.2025).
Analytical portal CoinCodex expects Intel’s average price to fall to $10.25 in early 2027. Throughout the year, a bullish trend will likely prevail. By mid-year, the asset’s value may gradually recover to $11.49 and surge to $15.12 by year-end.
| Month | Minimum, $ | Average, $ | Maximum, $ |
| January | 9.49 | 10.25 | 10.64 |
| February | 9.18 | 9.97 | 10.65 |
| March | 9.28 | 10.02 | 11.03 |
| April | 10.43 | 11.13 | 11.60 |
| May | 10.07 | 10.58 | 10.96 |
| June | 10.81 | 11.49 | 12.43 |
| July | 11.17 | 11.75 | 12.45 |
| August | 11.40 | 11.85 | 12.28 |
| September | 11.84 | 12.55 | 13.33 |
| October | 11.48 | 12.26 | 12.64 |
| November | 12.32 | 13.67 | 14.87 |
| December | 14.06 | 15.12 | 16.66 |
StockScan
Price range in 2027: $22.11–$43.35 (as of 10.02.2025).
StockScan predicts that Intel’s stock price will surge to $36.29 by early 2027. The average price will climb to $36.87 through July, with a projected yearly high of $43.35. However, a bearish reversal is expected, and the price may decline to $23.82 by the end of December.
| Month | Minimum, $ | Average, $ | Maximum, $ |
| January | 35.97 | 36.29 | 42.90 |
| February | 34.72 | 36.42 | 38.87 |
| March | 35.04 | 37.61 | 41.98 |
| April | 35.97 | 42.77 | 43.35 |
| May | 33.40 | 35.15 | 42.74 |
| June | 30.82 | 35.30 | 37.13 |
| July | 31.34 | 36.87 | 39.82 |
| August | 32.90 | 33.92 | 37.22 |
| September | 27.76 | 32.02 | 34.67 |
| October | 24.15 | 24.52 | 32.44 |
| November | 23.16 | 25.61 | 26.64 |
| December | 22.11 | 23.82 | 28.39 |
The forecasts indicate that Intel Corp. shares are poised to experience moderate growth in 2027, propelled by the expansion of its production capacity and strategic focus on AI chip production. However, competition with industry leaders such as AMD and NVIDIA may temper a substantial increase in value.
Analysts’ Intel (INTC) Shares Price Projections for 2028
Analysts have provided a range of estimates for Intel’s stock price in 2028, but there is no consensus among them.
LongForecast
Price range in 2028: $20.83–$40.07 (as of 10.02.2025).
Analysts at LongForecast assume that the asset’s value will trade near $30.06 at the beginning of 2028. In the first half of the year, the asset will show mixed performance, with a price declining to $20.83 in April and recovering to $29.91 by June. In the second half of the year, a bullish momentum is anticipated to persist, with a projected price of $37.10 by the end of December.
| Month | Open, $ | Min–Max, $ | Close, $ |
| January | 30.06 | 23.51–30.06 | 25.55 |
| February | 25.55 | 23.88–28.04 | 25.96 |
| March | 25.96 | 24.14–28.34 | 26.24 |
| April | 26.24 | 20.83–26.24 | 22.64 |
| May | 22.64 | 22.64–28.09 | 26.01 |
| June | 26.01 | 26.01–32.30 | 29.91 |
| July | 29.91 | 28.86–33.88 | 31.37 |
| August | 31.37 | 28.02–32.90 | 30.46 |
| September | 30.46 | 28.66–33.64 | 31.15 |
| October | 31.15 | 30.68–36.02 | 33.35 |
| November | 33.35 | 32.73–38.43 | 35.58 |
| December | 35.58 | 34.13–40.07 | 37.10 |
CoinCodex
Price range in 2028: $7.41–$16.37 (as of 10.02.2025).
According to CoinCodex, the INTC’s average price at the beginning of 2028 will be around $15.59. During the year, the price will experience a sustained decline. By the end of June, the asset may slide to $10.83, slumping to $7.99 by the year-end.
| Month | Minimum, $ | Average, $ | Maximum, $ |
| January | 14.47 | 15.59 | 16.37 |
| February | 14.22 | 14.50 | 14.92 |
| March | 14.02 | 14.61 | 15.21 |
| April | 10.88 | 12.47 | 14.67 |
| May | 10.63 | 10.91 | 11.26 |
| June | 10.69 | 10.83 | 10.95 |
| July | 10.77 | 11.50 | 12.25 |
| August | 7.62 | 7.96 | 10.59 |
| September | 7.41 | 08.04 | 8.93 |
| October | 8.33 | 8.53 | 8.75 |
| November | 8.27 | 8.95 | 9.50 |
| December | 7.54 | 7.99 | 8.99 |
StockScan
Price range in 2028: $12.48–$25.76 (as of 10.02.2025).
Analysts from StockScan predict high volatility in the tech giant’s shares in 2028. At the beginning of the year, experts project that the average price will hover around $19.00. By midyear, the asset’s value may decline to $17.41 and recover to $22.10 by the year-end.
| Month | Minimum, $ | Average, $ | Maximum, $ |
| January | 18.84 | 19.00 | 24.30 |
| February | 13.60 | 13.63 | 19.68 |
| March | 12.48 | 16.38 | 17.15 |
| April | 15.14 | 17.36 | 19.34 |
| May | 13.46 | 14.20 | 18.54 |
| June | 13.63 | 17.41 | 18.55 |
| July | 14.99 | 16.06 | 19.41 |
| August | 13.05 | 15.57 | 17.16 |
| September | 14.98 | 21.24 | 22.27 |
| October | 16.99 | 19.49 | 21.55 |
| November | 15.41 | 19.90 | 20.86 |
| December | 18.30 | 22.10 | 25.76 |
Analysts predict that the Intel stock will exhibit mixed performance in 2028. Optimistic forecasts suggest that the company will see a rebound in chip manufacturing and growth in revenues from new businesses such as AI. On the other hand, pessimistic analysts are concerned about increased competition and technological problems that could negatively affect the stock price.
Analysts’ Intel (INTC) Shares Price Projections for 2029
Most experts project a decline in the value of Intel’s shares in 2029.
CoinCodex
Price range in 2029: $5.53–$8.31 (as of 10.02.2025).
CoinCodex suggests that the INTC rate will decline in 2029. The analysts anticipate the average price to move near $7.80 at the beginning of the year, with a potential decline to $6.42 by the end of June. The forecast also points to a steeper decline in the latter half of the year, with a projected price of $5.82 by the end of December.
| Month | Minimum, $ | Average, $ | Maximum, $ |
| January | 7.43 | 7.80 | 8.31 |
| February | 6.45 | 7.08 | 7.56 |
| March | 6.81 | 7.24 | 7.49 |
| April | 6.23 | 7.17 | 7.70 |
| May | 6.19 | 6.45 | 6.59 |
| June | 6.01 | 6.42 | 6.61 |
| July | 5.74 | 6.05 | 6.49 |
| August | 5.79 | 5.97 | 6.19 |
| September | 5.79 | 5.99 | 6.24 |
| October | 5.53 | 6.03 | 6.38 |
| November | 5.63 | 5.75 | 5.90 |
| December | 5.64 | 5.82 | 6.04 |
Gov Capital
Price range in 2029: $14.92–$20.71 (as of 10.02.2025).
According to the investment portal Gov Capital, Intel stock is expected to show a neutral trend in 2029. The average price is predicted to be $16.58 at the beginning of the year. In the first half of the year, a recovery to $18.83 is anticipated. By December, the value may stabilize at $17.63.
| Date | Least price possible, $ | Average price, $ | Best price possible, $ |
| 31.01.2029 | 14.92 | 16.58 | 18.24 |
| 28.02.2029 | 15.76 | 17.51 | 19.26 |
| 31.03.2029 | 15.99 | 17.76 | 19.54 |
| 30.04.2029 | 16.12 | 17.92 | 19.71 |
| 31.05.2029 | 16.69 | 18.55 | 20.40 |
| 30.06.2029 | 16.94 | 18.83 | 20.71 |
| 31.07.2029 | 15.78 | 17.53 | 19.29 |
| 31.08.2029 | 15.59 | 17.33 | 19.06 |
| 30.09.2029 | 15.72 | 17.47 | 19.21 |
| 31.10.2029 | 15.99 | 17.77 | 19.55 |
| 30.11.2029 | 15.89 | 17.66 | 19.43 |
| 31.12.2029 | 15.86 | 17.63 | 19.39 |
StockScan
Price range in 2029: $13.55–$40.49 (as of 10.02.2025).
Analysts from StockScan expect the Intel stock to show mixed performance in 2029. At the beginning of the year, experts predict an average price of $24.53. By the middle of the year, the price is expected to recover to $39.46. In the second half of 2029, a bearish reversal is anticipated, with a target of $14.60 in December.
| Month | Minimum, $ | Average, $ | Maximum, $ |
| January | 20.06 | 24.53 | 25.95 |
| February | 20.85 | 22.08 | 24.79 |
| March | 22.06 | 26.78 | 28.97 |
| April | 22.58 | 24.95 | 27.31 |
| May | 21.16 | 27.93 | 28.06 |
| June | 27.16 | 32.88 | 34.46 |
| July | 30.33 | 39.46 | 40.49 |
| August | 31.67 | 32.39 | 39.59 |
| September | 30.92 | 32.37 | 34.63 |
| October | 30.88 | 32.04 | 36.06 |
| November | 23.72 | 23.74 | 34.92 |
| December | 13.55 | 14.60 | 24.86 |
By 2029, Intel Corp. shares may experience increased competition from AMD. The company’s success will depend on its capacity to innovate in the areas of artificial intelligence and data centers. Analysts anticipate a decline due to elevated geopolitical risks and shifts in the tech sector. In addition, the developments in chip manufacturing should be closely monitored.
Analysts’ Intel (INTC) Shares Price Projections for 2030
The estimates of Intel’s stock price in 2030 present a range of scenarios.
CoinCodex
Price range in 2030: $2.87–$6.38 (as of 10.02.2025).
CoinCodex estimates that the average value of the company’s shares will trade near $6.05. By the end of June, the price may slump to $4.54. In the second half of the year, the bearish trend will likely intensify, and the price will slide to $3.18 in December.
| Month | Minimum, $ | Average, $ | Maximum, $ |
| January | 5.42 | 6.05 | 6.38 |
| February | 5.15 | 5.46 | 5.67 |
| March | 5.11 | 5.52 | 5.94 |
| April | 5.16 | 5.41 | 5.73 |
| May | 4.76 | 4.98 | 5.22 |
| June | 4.27 | 4.54 | 5.09 |
| July | 4.17 | 4.39 | 4.61 |
| August | 3.68 | 4.01 | 4.17 |
| September | 3.03 | 3.36 | 3.64 |
| October | 2.87 | 3.05 | 3.27 |
| November | 3.17 | 3.34 | 3.53 |
| December | 2.96 | 3.18 | 3.43 |
Coin Price Forecast
Price range in 2030: $38.34–$42.06 (as of 10.02.2025).
According to Coin Price Forecast, Intel Corporation’s share price is projected to reach $38.34 in 2030. By mid-year, the value is expected to rise to $41.01, and by the end of the year, it is anticipated to increase to $42.06.
| Year | Mid-Year, $ | Year-End, $ |
| 2030 | 41.01 | 42.06 |
StockScan
Price range in 2030: $11.38–$39.23 (as of 10.02.2025).
Analysts at StockScan predict that the INTC stock will recover throughout 2030. At the beginning of the year, experts assume the price will reach $15.00, rising to $37.15 by the end of October. After that, a sharp decline to $20.50 in November and stabilization of the rate at $23.83 in December is expected.
| Month | Minimum, $ | Average, $ | Maximum, $ |
| January | 11.38 | 15.00 | 15.95 |
| February | 14.22 | 18.70 | 18.71 |
| March | 17.45 | 17.64 | 21.85 |
| April | 14.00 | 16.38 | 16.81 |
| May | 15.61 | 20.78 | 22.48 |
| June | 17.83 | 25.76 | 25.94 |
| July | 25.06 | 27.20 | 28.35 |
| August | 25.41 | 28.20 | 28.75 |
| September | 28.40 | 28.84 | 30.81 |
| October | 28.67 | 37.15 | 39.23 |
| November | 16.67 | 20.50 | 37.97 |
| December | 15.41 | 23.83 | 26.42 |
The outlook for Intel Corp. stock in 2030 is uncertain. The factors affecting the price include fierce competition from Intel’s main rivals, innovation in semiconductors, and geopolitical and macroeconomic factors. Intel’s growth potential by 2030 will be determined by its success in new technologies and its ability to adapt to changing market conditions.
Analysts’ Intel (INTC) Shares Price Projections until 2050
Forecasting Intel Corp. stock price performance for 2030–2050 is challenging due to numerous factors. The technological landscape is unpredictable, with competition, new breakthroughs, and paradigm shifts in computing. Geopolitical events, trade wars, and regulatory changes can significantly impact the share price. Economic cycles, inflation, and interest rates may spur volatility. Intel’s management, strategic planning and investments also play a key role. All these factors are difficult to predict over such a long time frame.
According to experts at StockScan, Intel’s stock price is expected to exhibit mixed performance between 2030 and 2050, with a strong decline to $3.49 by 2040 and a recovery to $16.20 by 2050.
Markettalkz experts offer more optimistic long-term forecasts. By 2040, analysts project a price of $203.00, and by 2050, they anticipate a rise to $2,700.00.
Analysts from Tradersunion are more cautious, forecasting a modest increase in the trading instrument’s price to $49.32 by 2040.
| Year | StockScan, $ | Markettalkz, $ | Tradersunion, $ |
| 2035 | 22.17 | 118.00 | 36.56 |
| 2040 | 3.49 | 203.00 | 49.32 |
| 2045 | 20.30 | – | – |
| 2050 | 16.20 | 2,700.00 | – |
Forecasting the future share price of Intel Corp. for the 2030–2050 period is a challenging task due to the influence of technological advancements and geopolitical shifts. Potential outcomes include maintaining a leading position in innovation, achieving steady growth, or experiencing a decline due to competitive pressures. Key factors include success in new markets such as AI and quantum computing, capital efficiency, and the ability to adapt to evolving market demands.
Market Sentiment for INTC (Intel) on Social Media
Media sentiment for Intel Corp. stock is a reflection of public opinion about the company expressed in the news and on social media platforms. Positive sentiment increases investor demand, potentially leading to increased share price. Conversely, negative sentiment can result in a drop in the INTC stock price.
Analyzing media sentiment can provide insights into short-term price fluctuations and the risks associated with Intel stock.
According to a user under the nickname T_sou955 on social platform X, INTC shares should recover in the coming months. The independent expert assumes that the value may increase to $38.00.
A user with the nickname DanielSen_csgo has expressed concern over the decline in INTC shares despite the company’s valuation exceeding $100 billion. The market participant suspects that the shares may have been deliberately manipulated to acquire them at a lower price. The user has no intention of selling their assets and believes that their fair value is at least $100.00 per share.
User Amed894515 concurs with the aforementioned expert’s assessment, anticipating the imminent end of manipulation on stocks such as AMD, Intel, ASML, and NVDA. In addition, the user forecasts significant developments in the chip manufacturing sector and encourages investors to refrain from selling their stocks.
A preliminary analysis of posts on social network X reveals a prevalent positive sentiment regarding INTC shares. Market participants anticipate a recovery in the asset price.
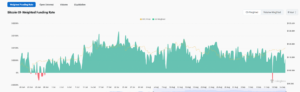
INTC Price History
Intel (INTC) reached its all-time high of $74.88 on 2000-08-31.
The lowest price of Intel (INTC) was recorded on 1982-01-13 when the stock declined to $0.22.
Below is a chart showing the performance of INTC over the last ten years. In this connection, it is important to evaluate historical data to make predictions as accurate as possible.
Between 2020 and 2025, Intel Corp.’s stock price demonstrated notable volatility, reflecting shifts in the technology landscape and fierce competition in the market.
- At the beginning of 2020, the share price was stable. However, with the onset of the COVID-19 pandemic, the price fell sharply but quickly recovered.
- In 2021, the stock faced significant fluctuations. Apple announced the transition of products to its chips, and there were reports of disruptions in Intel’s manufacturing cycles.
- In 2022 and 2023, the stock was under pressure due to heightened competition from AMD and NVIDIA, as well as evolving macroeconomic conditions.
- Thanks to new products and strategic initiatives, there were indications of recovery in early 2024, but steady growth never materialized.
- The stock has shown a mixed performance in early 2025, remaining under the influence of market sentiment and uncertainty about the company’s future prospects.
Intel (INTC) Shares Fundamental Analysis
Intel, a leading corporation in the semiconductor industry, is a primary focus for investors globally. The INTC stock is susceptible to shifts in the technology landscape and economic trends.
Fundamental analysis is a crucial technique for assessing the intrinsic value of Intel stock, assisting investors in making informed decisions based on the company’s financial performance, industry trends, and the competitive environment.
What Factors Affect the Intel (INTC) Stock?
- The current state of the semiconductor industry. Supply and demand, growth forecasts, and technology trends directly impact Intel’s outlook.
- Competition. The actions of AMD, NVIDIA, TSMC, and other competitors in the CPU, GPU, and contract manufacturing sectors also affect INTC’s price. A comparison of performance, stock price, and innovation helps assess the competitive environment in the industry.
- Performance and innovation. Intel’s capacity to release competitive processors and graphics solutions with new architectures and enhanced performance can drive stock price appreciation.
- Economic factors. Inflation, interest rates, and exchange rates influence demand and production.
- Technological breakthroughs. Artificial intelligence, cloud computing, and 5G generate new opportunities and risks for Intel.
- Political factors and regulation. Trade wars, export restrictions, and government investment in the semiconductor industry can significantly impact market conditions.
- Investor confidence. The collective perception of Intel stocks by investors and analysts, encompassing ratings and outlooks, will serve as a crucial driver of future price trends.
More Facts About Intel (INTC)
Founded in 1968, Intel Corporation is a global leader in the design and manufacture of microprocessors and other semiconductor components. The company has been central to the evolution of personal computers and is actively expanding its presence in the market for data centers and artificial intelligence.
Intel offers a wide range of products, including central processing units (CPUs), graphics processing units (GPUs), chipsets, network controllers, and solid-state drives (SSDs). The company allocates significant resources to research and development, ensuring its position at the forefront of technological innovation.
Intel is also actively involved in STEM (science, technology, engineering, and mathematics) education programs and initiatives to nurture the next generation of engineers and scientists.
Advantages and Disadvantages of Investing in Intel (INTC)
Investing in Intel (INTC) requires a thorough evaluation of potential risks and expected returns. As a leading player in the semiconductor industry, Intel encounters both beneficial macroeconomic factors and specific challenges within its sector.
Advantages
- An established brand and reputation. Intel is a well-established brand with a strong reputation in the technology industry, known for its innovation and commitment to research and development.
- Broad product portfolio. The company has a wide range of products, including central processing units (CPUs), graphics processing units (GPUs), chipsets, and other components for computers, servers, and other devices.
- Significant investment in research and development. Intel dedicates a substantial portion of its budget to R&D, enabling the development of cutting-edge technologies and products that enhance its competitive edge.
- Dividend yield. Intel consistently pays dividends to shareholders, making it an appealing option for income-oriented investors.
- Data center solutions provider. The increasing demand for cloud computing and artificial intelligence solidifies Intel’s position as a preferred supplier for data centers.
- Manufacturing capacity. Intel’s factories provide greater oversight of the production process, facilitating cost optimization.
Disadvantages
- Increased competition. Intel is facing increasing competition from AMD, NVIDIA, and ARM-based solutions that are taking market share.
- Tech lag. The company has had difficulty transitioning to more advanced technology processes, which has caused it to lag behind competitors in some areas.
- Cyclical nature of the industry. The semiconductor industry is subject to cyclical fluctuations in demand, which can negatively impact Intel’s revenues and profits.
- Geopolitical risks. International trade tensions and geopolitical risks may affect Intel’s supply chain and manufacturing capacity.
- High capital expenditures. Maintaining and modernizing manufacturing facilities requires significant capital expenditures.
- Dependence on the PC market. Despite diversification, Intel remains dependent on sales of its CPUs, demand for which is slowing.
How We Make Forecasts
The following components are integral to making forecasts for various trading instruments, including the INTC stock, in the short and long term:
1. Fundamental analysis, which encompasses the following aspects:
- evaluation of forecasts from leading analytical firms;
- assessment of the company’s financial performance, e.g., its market cap, revenues and expenditures, earnings per share, business profitability, return on investment, etc.;
- evaluation of news and statements related to the index;
- analysis of geopolitical and macroeconomic risks.
2. An analysis of market sentiment and public opinions on social media.
3. Technical analysis. As a rule, an asset’s quotes tend to be cyclical in nature, and many factors are already factored into its price. The price chart represents not just statistical data but also a reflection of market psychology. There are many tools and techniques for technical analysis. A more successful and conservative research model involves a combination of candlestick, chart, and indicator analysis. Multiple confirmations of price reversals allow you to find more favorable entry points with minimal risks and determine potential profit targets in advance.
Conclusion: Is Intel (INTC) a Good Investment?
Intel faces numerous challenges, including fierce competition and rapid technological shifts. To maintain its competitive edge, the company has been compelled to allocate substantial resources to research and development. Intel’s brand recognition and extensive experience provide a solid foundation for its endeavors.
The current valuation of Intel’s stock might appeal to risk-averse investors seeking stable returns. However, Intel’s capacity to innovate and effectively manage costs should be closely observed. Investing in Intel involves a degree of uncertainty but also offers the potential for substantial returns.
Intel Price Prediction FAQs
Price chart of INTC in real time mode
The content of this article reflects the author’s opinion and does not necessarily reflect the official position of LiteFinance broker. The material published on this page is provided for informational purposes only and should not be considered as the provision of investment advice for the purposes of Directive 2014/65/EU.
According to copyright law, this article is considered intellectual property, which includes a prohibition on copying and distributing it without consent.