Doji Candle Pattern: What It Is and How It Works

A Doji is a type of candlestick pattern in trading that indicates that neither bulls nor bears prevail in the market. The pattern resembles a bar chart pattern. It can often be found in any financial market, including Forex, commodities, cryptocurrencies, and stocks.
The main feature of a Doji candlestick is that opening and closing prices are almost at the same level, so the candle has a tiny or even no body. Sometimes, a Doji candlestick has a small body and long upper or lower shadows.
This article provides a detailed overview of what a Doji candlestick pattern is, how it can be interpreted, and how to use it in trading.
The article covers the following subjects:
Major Takeaways
-
Doji is a candlestick pattern characterized by almost identical opening and closing prices, resulting in a body that resembles a thin line. The Doji candle reveals a period of uncertainty in the market.
-
The Doji pattern features a small or no candlestick body and long wicks or shadows, hinting at price volatility during the formation period, yet with the price closing almost at the opening level.
-
Some of the most common types of Doji include Neutral Doji, Long-Legged Doji, Dragonfly Doji, Gravestone Doji, and Star Doji candlesticks. Each type has its unique interpretation.
-
The appearance of a Doji candlestick indicates a balance of power between buyers and sellers, where neither side can establish control over the market.
-
When trading a Doji candle, it should be confirmed by the subsequent candlesticks. A stop-loss order is usually placed beyond the Doji’s high or low, depending on the trade direction.
-
Due to the fact that there are different types of Doji candlesticks, the pattern is used in trend following and trend reversal strategies, as well as with other indicators to increase the accuracy of signals.
-
The advantage of the candlestick pattern is that it provides accurate reversal signals, while its drawbacks are the need for confirmation and the risk of false signals if the pattern is misinterpreted.
-
Doji candlestick patterns can be found on any time frame and market. Most often, they appear on daily and weekly charts, as well as in highly volatile markets such as Forex.
What Is a Doji Candle?
A Doji Japanese candlestick is a significant candlestick pattern that appears on a candlestick chart, indicating that the price is struggling to find a clear direction and that there is a balance between the two market forces. The pattern suggests that the market is hesitant. At the same time, it implies that a trend reversal is looming, signaling the onset of a new upward or downward trend.
What Does the Doji Candle Mean for Traders?
The Doji candlestick gives traders valuable signals, especially if the pattern appears on the daily time frame at the peak of the uptrend or the bottom of the downtrend. Its appearance tells market participants that a bearish trend reversal is impending or a correction is imminent.
In the classic Doji pattern, the opening price should match the closing price, but sometimes there is a minor difference of a few ticks. Therefore, when trading this pattern, it is necessary to wait for confirmation using other candlestick analysis patterns or technical indicators.
How Does the Doji Candle Forming?
A Doji candlestick pattern is well-known in the world of trading. It helps traders identify the peak of an uptrend on the chart, particularly when the pattern emerges after a long green candlestick. When there is a prolonged rally in the market and the asset is overbought, the appearance of a Doji warns buyers that demand is fading, and bears are gaining the upper hand and are about to reverse the existing uptrend.
However, in downtrends, a Doji loses its magic because the pattern indicates that the forces in the market are equal, meaning that the downside potential is the same as the upside potential, so the decline could continue inertially.
Therefore, it is essential to confirm a price reversal and a new trend using other candlestick patterns besides a Doji. Such confirmation can be provided, for example, by the Morning Star Doji pattern, which consists of three candlesticks.
Doji Candlestick Types
While the Doji candlestick is undoubtedly a powerful pattern, its significance can vary depending on its type. In this section, we will examine the different types of Doji candlesticks and what each type of the pattern signifies.
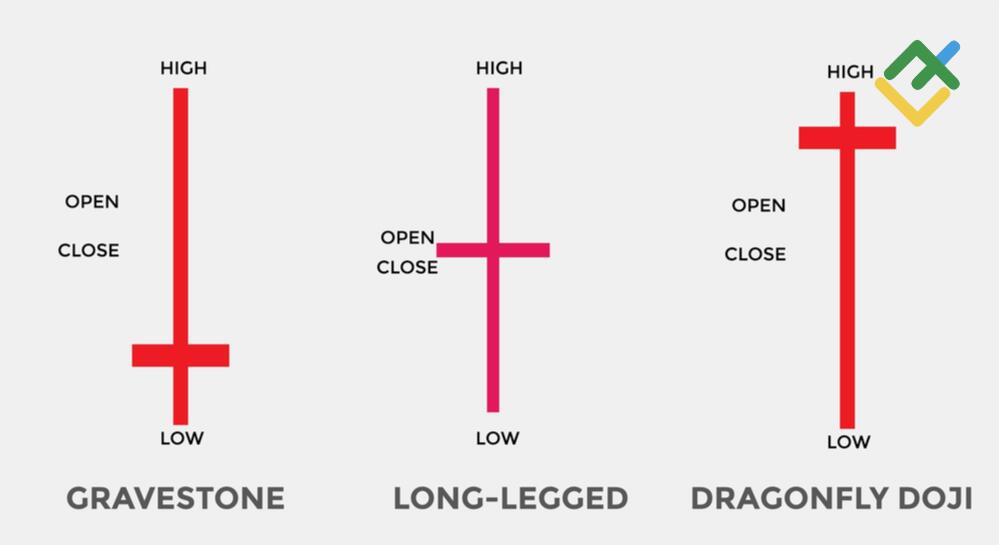
Long-Legged Doji
A Long-Legged Doji has long upper and/or lower shadows. This Doji pattern is particularly significant at the top of the bullish trend, as it indicates indecision in the market, and that bears are gaining strength.
Within the candlestick formation period, the price rises sharply, then falls, and by the end of the period returns to or approaches its opening price, pointing to a looming trend reversal.
If the price is in the middle of the candlestick’s range and the length of the shadows is the same, this formation is called a Rickshaw Man.
In addition, there is a type of candlestick with a small body and long upper and/or lower shadows, which is called a High Wave. The Japanese call such candlesticks “loss of sense of direction.”
Dragonfly Doji
The Dragonfly Doji pattern has a T-shaped formation and resembles a Dragonfly, hence its name. As a rule, this Bullish Doji appears in a downtrend, signaling a trend reversal. In some cases, the Dragonfly Doji bullish candlestick may also appear in an uptrend. However, when it appears in an uptrend, it requires additional confirmation from other candlestick patterns. This candlestick has a long lower shadow and no upper shadow or a very short one, which is why it is more bullish in nature.
Gravestone Doji
The Gravestone Doji has such a formidable name because it symbolizes a bearish trend reversal and the “burial” of an uptrend.
The principle behind this figure is that the price opens at the lows, soars, and then rolls back to the opening price. The pattern gives a particularly important signal in an uptrend, giving a warning to bulls about increased bearish activity. However, sometimes this bearish candlestick can also be found at the bottom of the downtrend, where it requires additional confirmation. As a rule, the longer the upper shadow of the Gravestone Doji, the stronger the reversal signal.
Neutral Doji
A Neutral Doji candle displays the same characteristics as a Rickshaw Doji. The price at the end of the formation period finishes its movement close to the opening price. However, the distance covered within the price range is the same in both directions, and the opening and closing prices are in the middle of the trading range. In other words, neither market force prevailed, which creates indecision in the market.
Standard Doji
A Standard or Classic Doji occurs when the opening and closing prices of an asset are almost equal, and the body of the candlestick looks like a very thin line.
Long upper and lower shadows indicate significant volatility during the trading period, pointing to uncertainty about the direction of the price movement.
On a price chart, the pattern reflects a balance between buyers and sellers. It can signal a potential bullish or bearish reversal, especially if the Doji appears after a long upward or downward movement.
However, a classic Doji should also be confirmed by signals received from technical indicators and candlestick patterns. Notably, a Doji alone most often does not generate a reliable signal; rather, it serves as a harbinger of potential shifts in market sentiment.
4-Price Doji
A Four-Price Doji is a special type of Doji pattern on a chart where the opening, closing, high, and low prices are the same. This Doji candlestick signals complete indecision in the market and looks like a horizontal line.
In essence, it shows that neither buyers nor sellers were able to significantly influence the price during the trading period. A Four-Price Doji indicates extreme stagnation and a lack of volatility. Such candlesticks are usually found in markets with very low trading volumes or on large time frames where the price sometimes remains virtually unchanged.
What is the Difference between a Doji and a Spinning Top?
The Doji pattern is a candlestick characterized by its shadows and almost no body, indicating that the closing price is the same as the opening price. Spinning Tops are candlestick patterns with a small body and, as a rule, long shadows. This is the main difference between the two candlestick patterns.
In general, Neutral Doji and Spinning Top candlesticks point to uncertainty in the market, which is confirmed by their wicks. That is, the market is crowded with both bulls and bears.
In both cases, the appearance of these candlesticks may signal a reversal, but it is necessary to wait for additional signals for confirmation.
How to Trade Doji Candlesticks?
Doji candlesticks perform more efficiently when trading on an H1 time frame or higher. On lower time frames, it appears too often to be considered a strong signal for a specific movement. In addition, there is market noise on these time frames, which can deceive traders.
Here is an example of a step-by-step trading strategy based on the Doji pattern using the Walt Disney Company stock:
1. First, it is important to determine the time frame, as well as the support and resistance levels. On the 4-hour time frame below, you can see the support and resistance levels, as well as the point where the price reached a swing high.
2. The next step after identifying the descending trend line is to analyze the candlestick chart at point 3. Here, we can see that after an upward correction, the asset formed a Dark Cloud Cover reversal pattern, followed by a Gravestone Doji. These patterns suggest that the market is bearish. In addition, after an attempt to break through the resistance line, bears pushed the price back down during the same period.
3. By the end of the trading session, it is clear that the asset will continue to decline further, therefore, it was possible to open a position during the formation of the Gravestone Doji, i.e., closer to the end of the session.
4. As illustrated, the following day exhibited a substantial downward gap, and bulls were unable to fill it. In the context of short-term trading, it is better to take profits at the nearest support level. More patient traders may want to wait until the quotes test the trend resistance line again. This approach will allow them to see how the asset will behave further. As a result, traders could pocket their profits in three different areas.
Pros and Cons of Trading Doji Candlestick
In this section, you can briefly familiarize yourself with the advantages and disadvantages of trading with Doji candlesticks.
|
Advantages |
Disadvantages |
|
It is a strong reversal signal at the peak |
False movements in the opposite direction are possible, leading to the formation of bull and bear traps |
|
It signals uncertainty in the market |
In a downtrend, a Doji may not signal a reversal, but rather a continuation of the trend, as market forces are equal |
|
It shows a trend’s peak, which provides a more favorable entry point |
Confirmation by other candlestick patterns is necessary |
|
It works best on the Forex and stock markets |
There are many varieties of this candlestick, including Gravestone Doji, Long-Legged Doji, Dragonfly Doji, and Doji after a long green candlestick, among others |
|
It is effective on hourly or higher time frames, allowing you to gain profits from a single trade |
It is not very effective on lower time frames of up to 1 hour, as these periods are more sensitive to market noise |
Doji Chart Pattern Examples
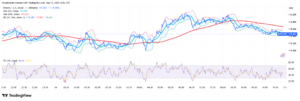
Let’s look at an example of live trading on the USD/CHF currency pair on a 4-hour chart. The screenshot below shows a Double Top price pattern. Since Shooting Star, Hanging Man, and Long-Legged Doji candlesticks are red near the second top, we can determine that the price hit a strong resistance area and failed to break through it.
Next, we see a rebound and the start of a new downward movement to the neckline of the Double Top price pattern, where the price found support. At the level of 0.9746, another Long-Legged Doji candlestick formed, which indicated uncertainty and emphasized strong support from buyers.
We can see a short upward correction, in which the asset formed another Doji candle and a Spinning Top pattern. That is, the pair was still under bearish pressure. Next, we see the formation of a large red candlestick, which gave a confirming signal to open a short position.
As you can see on the chart, a short trade of 0.01 lot was opened at this level. A stop-loss order was set at 0.9827. No take-profit was placed because it was a short-term intraday trade, and profits were taken manually.
After seven hours, the trade was closed manually at 0.9678, with a profit of $7.76, which is an excellent result for intraday trading.
Tips for Trading Doji Chart
It is important to consider the following criteria when analyzing and trading Doji candlesticks:
-
When performing technical analysis, use larger time frames.
-
Be sure to set stop-loss orders to control risks and avoid falling into market traps.
-
Open trades after you are sure that the price is moving according to your forecast. To do this, wait for confirmation using other candlestick analysis patterns or technical indicators.
-
It is better to rely on Doji candlesticks forming near support and resistance levels.
-
Use a more optimal 4-hour time frame.
-
Before opening a position, check the news and economic calendar.
Conclusion
A Doji candlestick pattern can take various forms, providing traders with a wealth of information and enabling them to identify optimal entry points.
Some types of Doji are often considered reversal patterns. Their appearance in the area of low or high prices indicates, first of all, uncertainty in the market. In most cases, it may indicate a possible trend reversal.
The Doji pattern is only a small part of all the candlestick patterns that exist in the world of trading. You can try out your new knowledge on a free and multifunctional demo account with LiteFinance.
The content of this article reflects the author’s opinion and does not necessarily reflect the official position of LiteFinance broker. The material published on this page is provided for informational purposes only and should not be considered as the provision of investment advice for the purposes of Directive 2014/65/EU.
According to copyright law, this article is considered intellectual property, which includes a prohibition on copying and distributing it without consent.