Falling Three Methods Candlestick Pattern: What It Is and How It Works

Candlestick patterns are among the most widely used tools in trading and are considered one of the most effective elements of technical analysis that help predict future price movements. There are many different types of candlestick patterns, and applying the most reliable formations, made up of three or more candlesticks, requires additional knowledge.
Among them are the Falling Three Methods and Rising Three Methods patterns. They tend to work best on higher time frames and can often signal opportunities for gains of around 10–18%. The article explains how to use the Falling Three Methods pattern for profitable Forex trading.
The article covers the following subjects:
Major Takeaways
|
What is the Falling Three Methods pattern? |
The Falling Three Methods is a pattern of candlestick analysis that appears on price charts after a strong bearish candlestick. The pattern indicates short-term changes in market sentiment and signals that the global market trend will continue. |
|
What is the difference between the Falling Three Methods and the Rising Three Methods? |
The Falling Three Methods pattern occurs after a large bearish candle, while the Rising Three Methods pattern emerges after a long bullish candle. |
|
How does the pattern influence the market? |
The Falling Three Methods is a continuation pattern that develops during a downtrend, signaling that the prevailing trend will likely strengthen. |
|
How does the pattern work? |
A trader opens a short position at the opening level of the fifth candlestick once three consecutive white candlesticks unfold, and holds the trade open until the price reaches the target level. |
|
How to recognize the pattern on a chart? |
The pattern consists of three small bullish candles, ideally with short shadows, formed consecutively after a tall bearish candle that completely encompasses all three candles within its body. |
|
Characteristics of the pattern |
The Falling Three Methods pattern is relatively easy to spot on a chart. However, if you do not follow the rules carefully, it can be mistaken for a Three-Line Strike pattern, which may result in losses. This formation is used across all types of financial markets. |
|
Advantages of the Falling Three Methods pattern |
The key advantages of this pattern are its straightforward structure, its reliability across different time frames, and its usefulness in highlighting potential entry points. |
|
Disadvantages of the Falling Three Methods pattern |
The pattern is relatively rare on the chart, can easily be mistaken for other formations, often lacks clear profit-taking levels, and typically requires traders to enter positions at the market price. |
|
Suitable time frames |
Although the pattern works on any time frame, it is more effective on higher time frames, as with most patterns. |
|
Stop order levels |
Orders are set after the third small candlestick closes, typically with a sell stop order below the pattern. |
What is the Falling Three Methods Candlestick Pattern?
The Falling Three Methods is a bearish continuation pattern. It is considered one of the most reliable signals for confirming the current trend, showing short-term fluctuations in trading volumes.
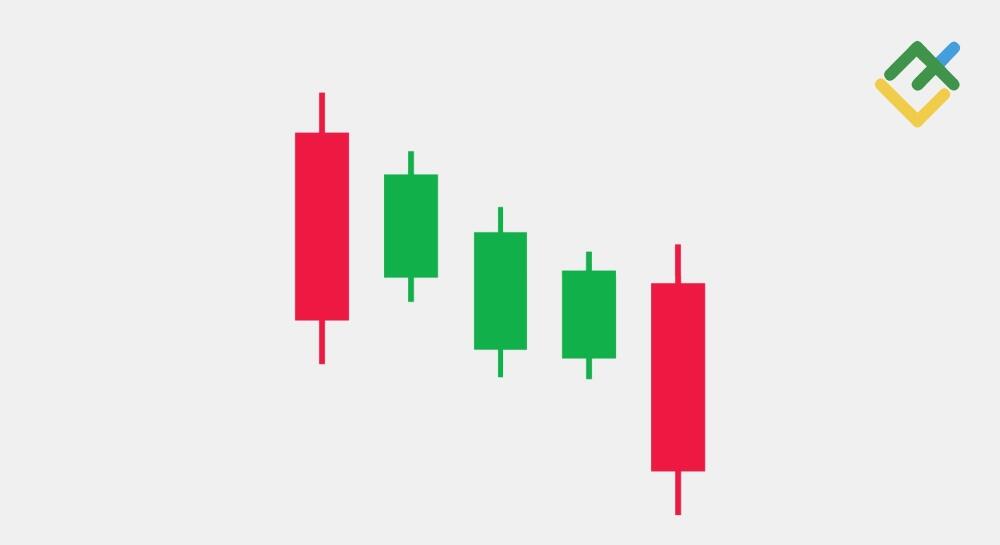
The Falling Three Methods pattern consists of a long black candlestick, three consecutive small white candlesticks, and a final long black candlestick that closes below the low of the first four candlesticks in the pattern
The Falling Three Methods is one of the few candlestick patterns that indicate the strength of a signal. The further the body of the last black candlestick of the pattern falls from the low of the first candlesticks, the stronger the signal. Conversely, the closer the closing price of the last candlestick is to the pattern's low, the weaker the signal.
The downtrend continuation signal is the strongest when the final bearish candlestick opens with a gap below the opening price of the preceding bullish candlestick.
Understanding the Formation of the Falling Three Methods Pattern
The oil chart below shows the Falling Three Methods pattern that formed within the downtrend. This pattern indicates a temporary pause in selling pressure and a continuation of the decline after a correction.
This pattern gave a standard signal, as the key condition was met: the final bearish candlestick closed well below the lows of the first four candlesticks.
This formation shows that buying volume has been fully absorbed and that bears have regained control of the market. The gap between the last candlestick’s close and the first candlestick’s low highlights the sellers’ strong advantage, suggesting the main downtrend may continue for a long time.
In this situation, a trader can open a short position at the close of the pattern’s last candlestick and set a trailing stop to maximize potential profit. There are also other ways to lock in gains, ranging from simple trend-following strategies to technical indicator signals. A stop-loss order should initially be placed at the high of the first candlestick and then replaced with a trailing stop.
The pattern structure is quite simple and consists of five candlesticks, three of which are small white ones, and the remaining two are large black candlesticks.
Identifying the Falling Three Methods Candlestick Pattern
Although this chart pattern rarely appears on price charts, it is relatively easy to recognize due to its distinctive elements.
- Before the pattern forms, the candlestick chart should show a clear downtrend with several long bearish candlesticks.
- The first candlestick is always a long bearish one with short shadows.
- The subsequent three small bullish candlesticks mark the beginning of the pattern formation.
- Each of the three bullish candlesticks should resemble the previous one and have approximately equal bodies.
- The third bullish candlestick must not close above the first candle’s open. Ideally, the bullish candlestick should close significantly lower.
- Another factor is how much the first tall bearish candle engulfs the three small bullish ones. If the three bullish candlesticks remain in the lower half of the first bearish candlestick, the continuation signal is especially strong.
- The pattern completes with another long bearish candle.
- The size and type of this candlestick are usually the basis for determining the strength of the future trend.
- The lower the final bearish candlestick closes below the first candlesticks in the sequence, the stronger the signal that the downtrend will continue.
- If a price gap forms between the last bullish candlestick and the new bearish one, this is the strongest signal to continue opening short positions.
Characteristics and Confirmation of the Falling Three Methods Pattern
The Falling Three pattern can easily be confused with other patterns. Therefore, you need to know all its characteristics clearly in order to identify it correctly on a candlestick chart. The Falling Three Methods trend continuation pattern always consists of five candles, three of which are white and two are black.
Below are the key rules for identifying the pattern, as well as common mistakes to avoid.
1. The first chart illustrates three major mistakes in identifying the pattern:
- The first bearish candlestick should have a long body that completely engulfs the three subsequent bullish candlesticks.
- The three white candlesticks on this chart have different sizes. The second white candlestick is even larger than the first black candlestick. In addition, these candlesticks go beyond the opening price of the first black candlestick.
- The last long bearish candlestick does not fully engulf the previous three bullish candlesticks. Moreover, its closing price is above the low of the previous three candlesticks in the pattern.
- Conclusion: the pattern is identified incorrectly, which may lead to losses.
2. The pattern on the second chart indicates a trend reversal, rather than a continuation, triggering a stop order:
- The first bearish candlestick is absolutely correct.
- There are errors in the structure of the white candlesticks. First of all, they are all of different sizes, and some of them even look like Evening Star and Shooting Star candlesticks. Also, there are four of these candlesticks, not three, which is a violation of the pattern structure.
- The last bearish candlestick looks correct, but because it is the sixth rather than the fifth, the pattern is disrupted.
- Conclusion: the pattern is identified incorrectly, which, judging by the chart, resulted in losses.
3. The third chart shows a mostly correct Falling Three Methods pattern:
- The first bearish candlestick looks perfect.
- The next three bullish candlesticks have roughly the same bodies and do not exceed the size of the first bearish candlestick.
- The last candlestick is long, but its body closed above the low of the first three candlesticks. You can interpret the pattern however you like, but there’s no big mistake here.
- Conclusion: the pattern with minor assumptions was identified correctly, and the downtrend continued, allowing traders to profit from short trades.
4. The fourth image shows the most common and correct way to identify the pattern:
- The first bearish candlestick is almost perfect. Although it does not engulf the subsequent candlesticks with its body, its shadow overlaps their bodies. Therefore, this is not considered a mistake.
- The three bullish candlesticks are almost identical in size and do not exceed the first candlestick.
- The last large bearish candlestick of the pattern closed below the lowest opening price of the previous candlesticks in the pattern.
- Conclusion: the pattern was identified correctly, and the bearish trend continued, allowing traders to profit from short trades.
The ideal Falling Three Methods pattern almost never occurs. However, if you follow the key rules, the pattern’s success rate is higher than 79%, which is quite a lot for a candlestick pattern.
Falling Three Methods vs. Rising Three Methods
Like most candlestick patterns, the Falling Three Methods has an opposite version called the Rising Three Methods. The pattern’s type depends on the prior trend. The Falling Three Methods appears only after a downtrend, while the Rising Three Methods pattern forms only after an uptrend.
The Falling Three Methods:
- The pattern always occurs during a downtrend and signals its continuation.
- The first candlestick of the pattern is always black.
- The next three candlesticks are always white and resemble the Three White Soldiers pattern. The formation can also comprise a Morning Star pattern.
- The final candle in the pattern is always black and resembles a Bearish Engulfing pattern.
- Once this pattern forms, the previous bearish trend continues.
The Rising Three Methods:
- The pattern always appears during an uptrend and indicates its continuation.
- The first candlestick of the model is always white.
- The following three candlesticks are always black. In some cases, the pattern can comprise Doji candlesticks or the Three Black Crows pattern.
- The last candle in the pattern is always white and resembles a Bullish Engulfing pattern.
- Once this pattern develops, the previous bullish trend continues.
Trading the Falling Three Methods Candlestick Pattern
To trade this pattern effectively, you first need to identify it correctly while keeping in mind potential pitfalls. For that, you can use my cheat sheet, which will help you spot the pattern and turn it to your advantage.
- The pattern always forms within an existing downtrend. It is essential to monitor the trend and look for long black candlesticks that clearly stand out from the others.
- Once the first big bearish candle appears, watch for three small white candlesticks with similar-sized bodies. The shadows are not critical, as long as they do not stretch far beyond the first black candle. If these three white candles form within the body of that initial black candle, there is a high probability that this is the Falling Three Methods.
- During the third phase, a new bearish candlestick with a long body should form, covering the previous white candlesticks. Moreover, the closing price of this candlestick should ideally be lower than the opening price of any of the earlier candlesticks in the pattern.
- If all five candles are complete and they comply with all the rules, you can open a short trade. The entry level for the trade should be at the closing price of the last black candlestick in the pattern. A stop-loss order should be set at the opening price of the first black candlestick in the pattern. It is best to take profits using a trailing stop.
Strategies for Trading the Falling Three Methods Pattern
Although the Falling Three Methods is a standalone candlestick pattern, there are many trading strategies in which the pattern is combined with other market indicators for Forex trading.
Pullbacks On Naked Charts
According to technical analysis, no trend develops without corrections. These corrections can be long-term or short-term. Short-term corrections, often called pullbacks, frequently appear within technical patterns.
Trading the Falling Three Methods is much like trading a Flag continuation pattern. Just as with a Flag, once the pattern is complete, the overall trend resumes. The trader’s task is simply to wait for the pullback to finish.
The Falling Three Methods consist of three white candlesticks. Once they form, the pullback is considered complete, and you can open a trade based on the main trend.
Support Levels
Just as no trend can exist without corrections, it also cannot develop without movement between support and resistance levels. In the case of the Falling Three Methods, support levels are critical, as the pattern is confirmed when the price breaks through them.
Often, the first bearish candlestick tests support and bounces, resulting in three smaller white candlesticks. At this point, traders are gearing up to try again to break through this level. If you see the pattern taking shape, scan the chart history. There is almost always a nearby support zone. If so, the real bearish signal comes when a strong black candlestick finally pierces this level.
Moving Averages
The Falling Three Methods pattern only exists within a downtrend. To confirm the pattern itself, you first need to make sure that the bearish momentum is still in place. The best way to do this is to use market indicators based on moving averages.
Add an exponential moving average (EMA) to the chart. If the period is set correctly, the pattern’s candlesticks will be below the EMA. Then watch for the white candlesticks to approach or touch the line. That is often the moment a rebound occurs and the final black candlestick forms, giving a signal to open a short trade.
Using the Awesome Oscillator for Entries and Exits
Another useful technical indicator that works well with the Falling Three Methods is MACD, or Bill Williams’ Awesome Oscillator, which is adapted for lower time frames.
While the pattern is forming, the market is in a downtrend, and the AO histogram bars confirm this by staying below the zero line and decreasing with each new bar. Once the final candlestick of the pattern appears, check the AO: if the bar for that candlestick is red, you can open a short position. When the AO shows its first green bar, close the trade and lock in profits.
Fibonacci
Fibonacci retracement levels can help identify exit points when trading the Falling Three Methods. Most modern platforms provide a bunch of tools based on these levels, and Fibonacci extensions are particularly useful for trading this bearish pattern.
This valuable tool is used to determine when the trend ends and is applied to the chart based on the previous correction. Since the Falling Three Methods is a correction, measure from the start of the first strong bearish candlestick to the end of the last small white candlestick. The Fibonacci extensions from this move highlight three take-profit levels: 61.8% as the conservative target, 100% as the standard target with higher potential reward, and 161.8% as the maximum target for aggressive traders.
Benefits of the Falling Three Methods Pattern
Like most candlestick patterns, the Falling Three Methods confirms the continuation of the broader trend. Its key advantages are the following:
- The pattern often appears on price charts. Since the Falling Three Methods and the Rising Three Methods comprise a simple sequence of five Japanese candlesticks, they are easy to spot on a chart of any asset and on any time frame.
- The pattern can be used to trade any instrument. Although the pattern was first employed in the stock market, similar patterns exist in currency charts, so it can be used to trade currency pairs and commodities.
- The pattern has clear order levels. Since the pattern itself is tied to the opening and closing prices of candlesticks, the levels of stop and take orders are also linked to these points, which greatly simplifies risk management.
- The pattern has highly profitable variations. Beyond the classic setup, the Falling and Rising Three Methods can be adapted into strategies that aim to enter not after the pattern completes, but while it is still forming.
Trading Tips for the Falling Three Methods Pattern
These are the key points that can help when trading the pattern:
- To recognize the pattern on a chart, simply identify a stable trend with price pullbacks. Keep in mind that a single candlestick correction on a daily chart may be a pattern on the H4 time frame.
- Do not rush into a trade immediately after the fifth candle closes. As a rule, the closing price of this candlestick is the lowest. Frequently, after it closes, there is an upward pullback, during which you can open a short trade at a more favourable price.
- Do not place orders until the last candlestick of the pattern closes. The pattern structure usually breaks on the last candlestick, causing the price to spike and trigger your stop-loss order.
- Avoid trading this pattern if the white candlestick closes above the opening price of the first black candlestick. Although the setup may still work, the profit potential is usually no greater and often less than the amount you risk losing if the stop-loss is triggered.
Conclusion
To sum up, the Three Falling Methods and the Three Rising Methods are very powerful technical analysis tools that can help traders decide whether to hold an existing trade open or initiate a new one. In some cases, the Three Falling Methods can even become the basis for a trading strategy that will generate stable income.
However, candlestick patterns are never completely reliable, as their effectiveness depends on compliance with a set of key rules. In the end, building a profitable trading strategy comes down to combining these elements correctly and following proper risk management techniques.
Falling Three Methods FAQs
The content of this article reflects the author’s opinion and does not necessarily reflect the official position of LiteFinance broker. The material published on this page is provided for informational purposes only and should not be considered as the provision of investment advice for the purposes of Directive 2014/65/EU.
According to copyright law, this article is considered intellectual property, which includes a prohibition on copying and distributing it without consent.