NEM Elliott Wave technical forecast [Video]

NEM Elliott Wave technical analysis
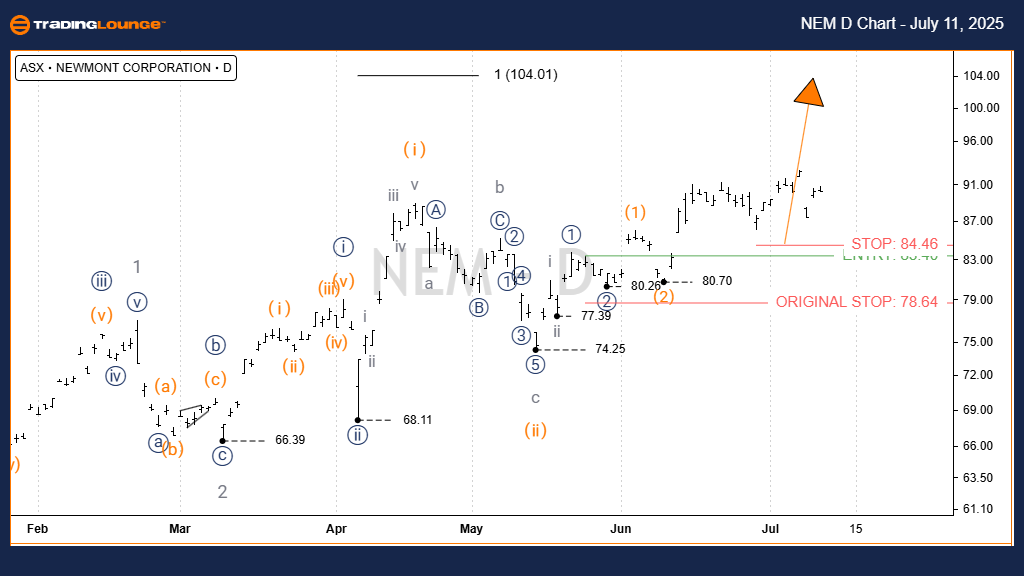
Today’s Elliott Wave update looks at Newmont Corporation (ASX: NEM) on the daily chart. The current upward move appears to be part of a Wave Three rally. We’ll explain the target price levels and invalidation points to help determine whether the bullish trend continues or ends.
-
Function: Major trend (Minor degree, grey).
-
Mode: Motive.
-
Structure: Impulse.
-
Position: Wave iii) – orange of Wave iii)) – navy of Wave 3 – grey.
Analysis:
Wave ii) – orange likely completed near 74.25, forming a zigzag correction. After this low, Wave iii) – orange is pushing upward, targeting around 100.00.
Invalidation point: 74.25.
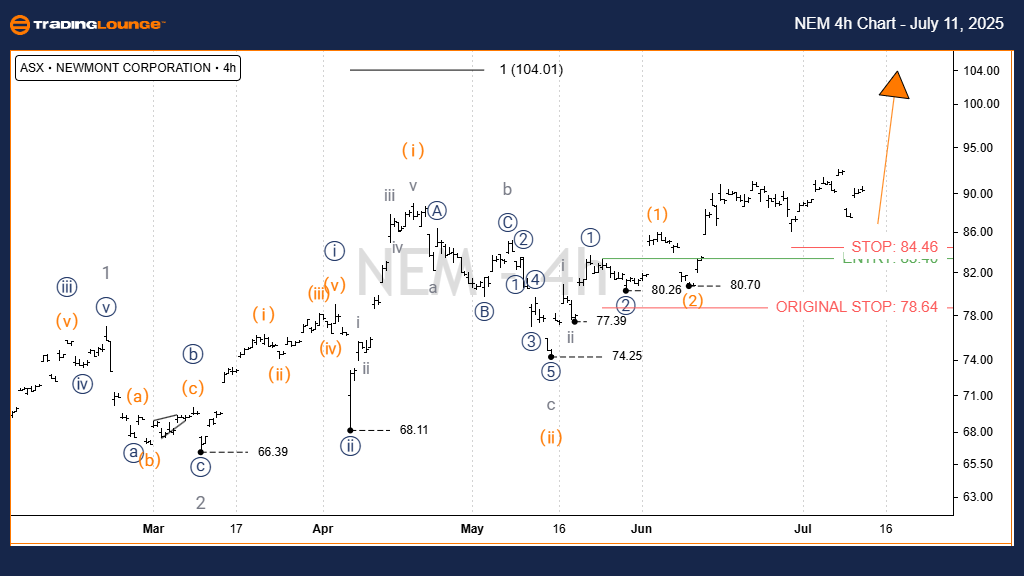
NEM Elliott Wave technical analysis
-
Function: Major trend (Minor degree, grey).
-
Mode: Motive.
-
Structure: Impulse.
-
Position: Wave iii) – orange of Wave ((iii)) – navy of Wave 3 – grey.
Short-term view:
The 4-hour chart aligns with the daily. Wave iii) – orange continues rising. Immediate target is 90.00, with a medium-term goal of 100.00.
Invalidation point: 74.25.
Conclusion
This analysis of ASX: NEM offers both a broad market view and short-term trading insight. Key price levels highlight where the trend is valid or invalid. This approach improves decision-making confidence and helps traders navigate market movements with a structured strategy.