Rectangle Chart Pattern: Complete Trading Guide

Among chart formations in technical analysis, the rectangle pattern is as widely known as the head and shoulders pattern. This pattern, which belongs to rectangular formations, represents a period of price consolidation confined between two horizontal trendlines of support and resistance. It reflects a temporary balance between buyers and sellers and signals the current trend continuation.
When analyzing a rectangle, traders can identify potential entry points as the price breaks through one of the pattern’s boundaries. This formation is often referred to as a continuation chart pattern, as the price usually moves in the direction of the prevailing trend after the consolidation phase. The successful application of the rectangle pattern in Forex requires careful analysis of trading volumes and confirmation of signals.
In this article, we will explore the rectangle in detail so that you can effectively incorporate this pattern into your trading strategy.
The article covers the following subjects:
Major Takeaways
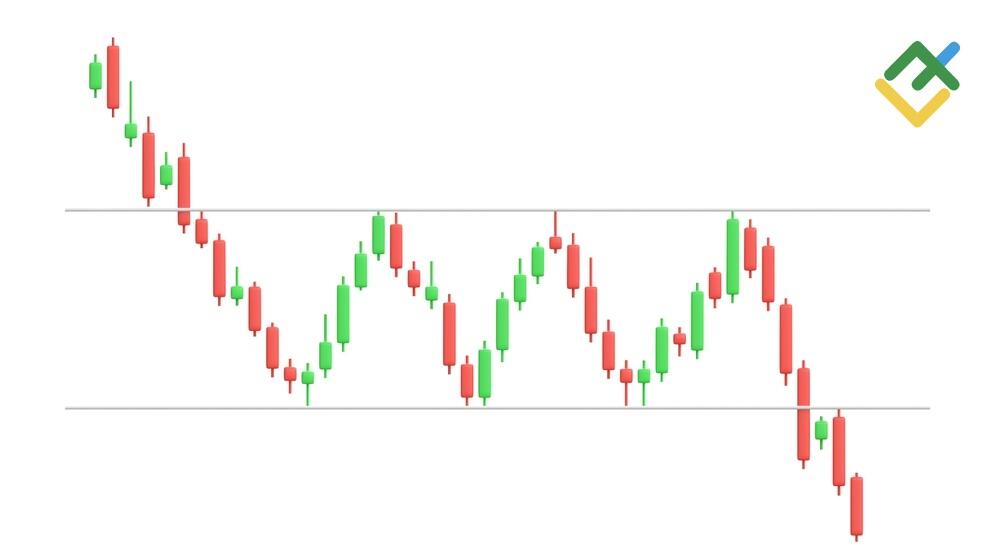
- The rectangle appears when the price stays within a trading range defined by two levels: resistance at the top and support at the bottom.
- How to recognize the rectangle? The price enters a sideways movement, as if it is locked between these horizontal lines.
- It is important that the horizontal support and resistance are clearly visible, with the price touching these support and resistance levels several times.
- This consolidation pattern forms when buyers and sellers are unable to gain the upper hand and push the price in either direction.
- How to trade it? There are two options: either open long positions when a price breakout occurs above the resistance level, or open short positions when the price breaks below the support line. A stop loss should be placed just beyond the broken level.
- Oscillators can also be used to confirm volume and to filter out false breakouts.
- The advantage of the rectangle continuation pattern is that it makes it easy to define entry points, stop-loss levels, and price targets. The drawback: false breakouts are common, and traders often have to wait for confirmation before acting.
How Rectangle Chart Patterns Work
The rectangle pattern appears when the price moves between two lines: the upper boundary is resistance, and the lower boundary is support. This reflects a balance between buyers and sellers, with neither side able to gain a significant advantage.
When a breakout occurs above or below the rectangle, there is a high probability that the price movements will continue in the direction of the breakout. If resistance is broken, the price is likely to move upward; if support is broken, the market will likely continue to move downward. Ideally, an increase in trading volume during the breakout confirms and strengthens the signal.
Important to note: The rectangle can act as both a continuation pattern and a potential trend reversal signal. Therefore, before opening a position, it is recommended to use additional technical analysis tools to confirm the trading signal.
Types of Rectangle Chart Patterns
The rectangle chart formation is one of the most common chart patterns. This formation helps traders identify an optimal entry point after a phase of market consolidation within clearly defined support and resistance levels.
Bullish Rectangle Pattern
A bullish rectangle forms during an uptrend and looks like a trading range where the price is confined between horizontal support and resistance lines. Buyers seem to pause, giving sellers a chance to push the price slightly lower.
However, if a price breakout occurs above the upper boundary, it usually signals trend continuation to the upside. This setup allows traders to define stop-loss levels and price targets for their trading strategy.
Bearish Rectangle Pattern
The bearish rectangle (often shown in red) indicates that a downward trend is likely to continue. It looks like a flat movement or channel that appears after a price decline. If the price breaks below the lower support level, the bearish price action is expected to extend further.
The measuring principle is applied as follows: the height of the rectangle is measured and projected downward from the breakout point to determine approximate price targets for short positions.
However, no chart pattern provides a 100% guarantee of profit. It is more practical to combine this continuation pattern with other technical indicators, price patterns, market sentiment analysis, and volume confirmation to filter false breakouts and strengthen the overall trading strategy.
How to Use Rectangle Chart Patterns for Trading Breakouts
Let’s look at the trading algorithm for the rectangle pattern:
- How to identify it: pay attention when, after a bullish trend or a bearish trend, the market takes a trend pause and shifts into a flat range. It is important that the price touches both the upper resistance and the lower support at least twice.
- If a price breakout occurs above the upper line, a long position can be opened, since the price action is likely to continue upward. Conversely, when the breakout happens below the lower support level, a short position can be opened.
- A buy order is usually placed slightly above the resistance line, and a sell order is placed slightly below the support.
- Profit target calculation. Measure the height of the rectangle. In a bullish rectangle, project this distance upward from the breakout point of the resistance. In a bearish rectangle, project the same distance downward from the breakout point of the support line. These calculations help traders set realistic price targets.
- When opening a long position, place the stop-loss order just below the broken resistance. When opening a short position, set the stop order just above the broken support. This approach limits potential losses and strengthens the overall trading strategy.
- Use technical indicators, such as RSI or MACD, to confirm the signal and avoid false breakouts.
- Practice identifying this consolidation pattern on a demo account before switching to live trading.
- Important to remember: always monitor price action and market sentiment when working with rectangle chart formations.
Rectangle Pattern Trading Strategy
A trading strategy based on the rectangle pattern allows traders to identify periods of market consolidation and forecast the next price action following a breakout from the formation.
Trading Strategy with the Bullish Rectangle
When trading the bullish rectangle, it is important to wait for a bullish breakout above the upper boundary of the chart formation. Typically, the price then moves upward by approximately the height of the rectangle. To avoid mistakes, traders should monitor trading volume: if volume increases during the breakout, this volume confirmation strengthens the signal to open long positions.
A stop-loss order is usually placed just below the breakout point to limit potential losses. The take-profit level, or price target, is set by applying the measuring principle: measure the height of the rectangle and project it upward from the breakout point. The primary goal is to avoid impulsive actions and remain patient when implementing this trading strategy.
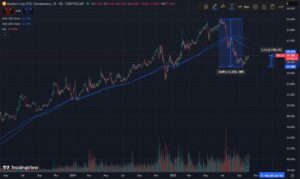
Let’s look at an example of trading the bullish rectangle on the daily chart of Microsoft Corp.
- First, identify an uptrend and the rectangle chart formation.
- Then, add indicators such as VWAP and SMA20 for additional confirmation of the price breakout, while Fibonacci channels can be used to define potential price targets.
- The chart shows that the price has broken above the upper resistance line of the rectangle around the level of $56.86, generating a trading signal to open long positions.
- A stop loss was set below $55.00 or at the 0.786 Fibonacci level.
- After the breakout, the price moved sideways for some time before the bulls finally pushed it above $56.86.
- Profit targets were set at $62.22 (1.618 Fibonacci) and $70.90 (2.618 Fibonacci). An intermediate price target of $65.26 was calculated based on the height of the rectangle.
- It is also worth noting that during the breakout, the VWAP and the SMA20 line were positioned below the market price. This alignment provided additional confirmation of bullish momentum.
Trading Strategy with the Bearish Rectangle
The essence of this trading strategy is to identify a bearish rectangle with horizontal support and resistance levels and open a short position when a downward breakout occurs below the lower boundary.
A stop loss is set just above the breakout point to limit potential losses.
Profit target calculation: measure the height of the rectangle and project this distance downward from the breakout point. For more confidence, it is advisable to use technical analysis indicators to confirm the signal.
Let’s look at an example of trading the bearish rectangle on the four-hour chart of UKBRENT.
- First, a downtrend and the rectangle chart formation must be identified.
- Next, add indicators such as VWAP and SMA20 for breakout confirmation, while Fibonacci channels can be used to define potential price targets.
- The chart shows that the bears pushed the price below the support level around the level of $73.80, generating a trading signal to open short positions.
- A stop loss was set above $74.52 or at the 0.786 Fibonacci level.
- After the breakout, the price retested the broken support, confirming that the quotes had firmly consolidated below $73.80.
- Profit targets were set at $72.06 (1.618 Fibonacci) and $69.10 (2.618 Fibonacci). An intermediate price target of $70.94 was calculated using the measuring principle based on the rectangle’s height.
- It is also worth noting that at the breakout point, the VWAP and SMA20 lines were positioned above the market price. This provided additional confirmation of bearish market sentiment.
Measuring Principle and Price Targets
When the price breaks out of a rectangle chart formation, there are several ways to forecast its future movement:
- The simple method: measure the height of the rectangle (the distance between the upper resistance and lower support). For an upside breakout, add this height to the breakout point to determine the potential target.
- Fibonacci levels can also be used to refine price targets. Apply Fibonacci channels or extensions from one boundary of the rectangle to the opposite side where the breakout occurred. Traders often monitor 161.8%, 261.8%, and 423.6% levels.
- The most reliable approach is to combine several methods. For example, first apply the measuring principle to determine a base target, and then check Fibonacci levels to identify additional profit targets.
Volume Confirmation in Rectangle Patterns
To validate the rectangle consolidation pattern, it is essential to observe trading volumes. If the volume rises during the breakout, it is a positive sign: the market is interested in the new direction, and the price breakout is likely to be a valid one.
If the volume remains low, traders should be cautious. This could indicate a false breakout, after which the price may return inside the trading range.
Within the rectangle itself, volume is usually low and relatively stable, reflecting flat movement and market indecision.
Common Trading Mistakes and Risk Management
When trading the rectangle chart formation, beginners often repeat the same mistakes. For example, they may enter a trade on an unconfirmed price breakout. The price can fluctuate near the boundary and then move back, leading to losses. That’s why it is important to always set a stop loss — usually just below the breakout in a bullish scenario or just above it in a bearish trend.
Keep in mind that not every breakout guarantees success. False breakouts are common, especially in periods of high volatility. Another frequent mistake is ignoring volume confirmation. If trading volume increases during the breakout, the movement is strong. If the volume is weak, the breakout may turn out to be false, and the market may return to the trading range.
It is not advisable to trade every rectangle pattern. Focus only on a clear rectangle pattern where the support and resistance levels are clearly defined and where volume confirmation supports the price breakout. And always remember the principles of risk management.
Conclusion
The rectangle is one of the trading chart patterns considered a classical technical analysis pattern. On the price chart, the price fluctuates within a range trading phase until an upward breakout or downward move aligns with broader market trends. Like other technical patterns, it helps traders make more informed trading decisions.
The key is to correctly identify the parallel lines of support and resistance levels and make sure the breakout is supported by strong trading volumes. It is also important to follow money and risk management rules to minimize potential losses.
Although the rectangle continuation pattern looks simple, it requires patience and attention. Stop-loss placement, volume confirmation, and awareness of overall market sentiment can increase potential profit and reduce risks. Try trading this chart formation on a free demo account with LiteFinance to improve your trading strategy!
Get access to a demo account on an easy-to-use Forex platform without registration
Go to Demo Account
The content of this article reflects the author’s opinion and does not necessarily reflect the official position of LiteFinance broker. The material published on this page is provided for informational purposes only and should not be considered as the provision of investment advice for the purposes of Directive 2014/65/EU.
According to copyright law, this article is considered intellectual property, which includes a prohibition on copying and distributing it without consent.