Review of the main events of the Forex economic calendar for the next trading week (24.02.2025 – 02.03.2025)


Trump and his unexpected statements have once again captured the attention of market participants. Since taking office, the newly elected US President seems to be the main newsmaker. His remarks continue to stir the markets, driving the US dollar to new highs and then pushing it down more than any macroeconomic data release. If he could influence the Fed, he would certainly do it as well!
Amid extreme uncertainty, investors still prefer traditional safe-haven assets like gold, government bonds, and the yen. Interestingly, the US dollar seems to have temporarily lost its place on this list!
In the coming week, 24.02.2025 – 02.03.2025, market participants will focus on the publication of important macroeconomic data on the US, Canada, Australia, Switzerland, Japan, China, and Germany.
Besides, this week marks the final trading week of February.
Note: During the coming week, new events may be added to the calendar, and/or some scheduled events may be canceled. GMT time
The article covers the following subjects:
Major Takeaways
- Monday: no important macro statistics is scheduled.
- Tuesday: US Conference Board Consumer Confidence Index.
- Wednesday: Australian CPI
- Thursday: Swiss GDP, US annual GDP, Japanese CPIs.
- Friday: Chinese PMIs, German retail sales, German CPIs, Canadian GDP, and US Core PCE price index.
- Key event of the week: US Core PCE price index release.
Monday, February 24
There are no important macro statistics scheduled to be released.
Tuesday, February 25
15:00 – USD: Consumer Confidence Index
A Conference Board’s survey of nearly 3,000 US households evaluates current and future economic conditions and overall economic sentiment. Consumer confidence in the country’s economic development and stability is a key indicator of consumer spending and, consequently, economic performance. High confidence levels suggest economic growth, while low levels indicate stagnation.
Previous indicator values: 104.1 in January 2025, 104.7 in December 2024, 111.7, 108.7, 98.7, 103.3, 100.3, 100.4, 102.0, 97.0, 104.7, 106.7, 114.8, 110.7, 102.0, 102.6, 103.0, 106.1, 117.0, 109.7, 102.3, 101.3, 104.2.
The increase in the indicator values will bolster the US dollar exchange rate, while the decrease will weaken it.
Wednesday, February 26
00:30 – AUD: Consumer Price Index
The Consumer Price Inflation Index, published by the Reserve Bank of Australia and the Australian Bureau of Statistics, gauges retail prices of goods and services in Australia. The CPI is the most significant indicator of inflation and changes in consumer preferences. A high indicator reading is positive for the Australian dollar, while a low reading is negative. Previous indicator values: +2.5% in December, +2.1% in October and September, +2.7% in August and +1.0% (+3.8% YoY) in Q2 2024, +1.0% (+3.6% YoY) in Q1 2024, +0.6% (+3.4% YoY) in Q4 2023, +1.2% (+5.4% YoY) in Q3, +0.8% (+6.0% YoY) in Q2, +1.4% (+7.0% YoY) in Q1 2023, +1.9% (+7.8% YoY) in Q4 2022, +1.8% (+7.3% YoY) in Q3, +1.8% (+6.1% YoY) in Q2 2022, +2.1% (+5.1% YoY) in Q1 2022, +1.3% (+3.5% YoY) in Q4, +0.8% (+3.0% YoY) in Q3, +0.8% (+3.8% YoY) in Q2, +0.6% (+1.1% YoY) in Q1 2021.
The Australian central bank’s CPI inflation target ranges between 2% and 3%. According to the minutes of a recent RBA Board meeting, the bank may need to increase interest rates over time to bring inflation back to the target range and take further measures in the coming months to stabilize monetary conditions in Australia.
Now, the RBA, like most of the world’s other major central banks, is facing persistently high inflation.
The expected positive CPI reading will likely strengthen the Australian dollar. If the indicator readings are worse than the forecast or the previous value, the Australian dollar will face short-term negative effects.
Thursday, February 27
08:00 – CHF: Swiss GDP for Q4 2024
GDP is considered an indicator of the general state of a country’s economy, which measures its growth or decline rate. The GDP report represents the total monetary value of all final goods and services produced by Switzerland over a given period. A rising trend of the GDP indicator is considered positive for the Swiss franc, while a low result is considered negative.
Previous values: +0.4% (+2.0% YoY) in Q3, +0.7% (+1.8% YoY) in Q2, +0.5% (+0.6% YoY) in Q1, +0.3% (+0.6% YoY) in Q4 2023, +0.3% (+0.3% YoY) in Q3, 0% (+0.5% YoY) in Q2, +0.3% (+0.6% YoY) in Q1 2023.
The data indicates that the Swiss economy is recovering, albeit still at a slow pace, which is a positive factor for the Swiss franc.
If the data prove to be lower than forecast, the Swiss franc may decline in the short term. However, the currency will not fall sharply, as it is in strong demand as a defensive asset. Better-than-forecast data may strengthen the franc in the short term.
13:30 – USD: US annual GDP for Q4 (Second Estimate)
The GDP data is one of the key data (along with labor market and inflation data) for the US Fed in terms of its monetary policy. A strong result bolsters the US dollar, while a weak GDP report negatively affects the currency. In Q3, GDP gained +3.1%, following +3.0% in Q2, +1.6% in Q1 2024, +3.2% in Q4 2023, +4.4%, +2.4% in Q2, +2.8% in Q1 2023.
If GDP declines in Q4 2024, the US dollar will face strong pressure. Conversely, positive GDP data will support the greenback and US stock indices.
The preliminary estimate stood at +2.3%.
12:30 – USD: Durable Goods Orders. Non Defense Goods Orders Excluding Aircraft
Durable goods are tangible products with an expected lifespan of more than three years, such as cars, computers, household appliances, and aircraft. These goods require significant investment to produce. Durable goods orders data is a leading indicator representing the change in the total value of new orders received by producers. An increase in orders for these goods indicates that manufacturers are ramping up production to meet the demand.
Capital goods are durable items used to produce other goods and services. The current indicator excludes goods manufactured in the defense and aviation sectors of the US economy.
Positive data boost the US dollar, while negative figures adversely affect it. Any indicator deterioration compared to previous and/or forecasted values may also have a detrimental effect on the US dollar quotes, while data surpassing the forecast will positively influence the currency.
- Previous values of the durable goods orders indicator: -2.2%, -2.0%, +0.7%, -0.4%,-0.9%, +9.8%, -6.9%, +0.1%, +0.6%, +0.8%, +0.7%, -6.9%, -0.3% in December 2023;
- Previous values of the non-defense goods orders excluding aircraft indicator: +0.5%, +0.9%, -0.1%, +0.3%, +0.2%, -0.3%, +0.6%, -0.9%, +0.2%, -0.2%, +0.5%, -0.6%, +0,6% in December 2023.
23:30 – JPY: Tokyo Consumer Price Index (CPI). Tokyo Core CPI excluding Food and Energy
Tokyo’s consumer price indexes, published by the Statistics Bureau of Japan, gauge the price change of a selected basket of goods and services over a given period. These indexes are key indicators for assessing inflation and consumer preferences.
Previous values YoY:
- Tokyo CPI: +3.4%,+3.1%, +2.6%, +1.8%, +2.1%, +2.6%, 2.2%, +2.3%, +2.2%, +1.8%, +2.6%, +2.5%, +1.8%, +2.4%, +2.6%, +3.3%, +2.8%, +2.9%, +3.2%, +3.2%, +3.2%, +3.5%, +3.3%, + 3.4%, +4.4% in January 2023;
- Tokyo CPI excluding food and energy: +2.5%, +2.4%, +2.2%, +1.8%, +1.6%, +1.6%, +1.5%, +1.8%, +2.2%, +1.8%, +2.9%, +3.1%, +3.3%, +3.5%, +3.6%, +3.8%, +4.0%, +4.0%, +4.0%, +3.8%, +3.9%, +3.8%, +3.4%, +3.1%, +3.0% in January 2023.
The indicator reading lower than forecasted and/or previous values may weaken the yen, while a rise in the indicator may strengthen the currency.
Friday, February 28
01:30 – CNY: China’s Manufacturing and Services PMI by the China Federation of Logistics and Purchasing (CFLP)
This indicator is an essential gauge of the overall Chinese economy. An indicator reading above 50 is positive for the yuan, while a value below 50 is negative for the currency.
Previous values: 49.1 in January 2025, 50.1 (December 2024), 50.3, 50.1, 49.8, 49.1, 49.4, 49.5, 50.4, 50.8, 49.2, 49.0, 49.5, 50.2, 49.3, 49.0, 48.8, 49.2, 51.9, 52.6, 50.1 in January. The relative rise in the index above 50 strengthens the yuan. Data above 50 indicates increased economic activity, positively affecting the national currency. Conversely, if the index value is below 50, the yuan will face pressure and probably decline.
Likewise, the services sector PMI assesses the state of the services sector in the Chinese economy. An indicator result above 50 is seen as positive for the yuan. Previous values: 50.2 in January 2025, 52.2 in December 2024, 50.0, 50.2, 50.0, 50.3, 50.2, 50.5, 51.2, 53.0, 50.7, 50.4, 50.6, 51.7, 51.5, 53.2, 54.5, 56.4, 58.2, 56.3, 54.4 in January. Despite the relative decline, the indicator is still above the 50 value, likely influencing the yuan positively. Conversely, the indicator below 50 suggests that the yuan will face pressure and probably decline.
07:00 – EUR: German Retail Sales
Retail sales is the main indicator of consumer spending in Germany. A high indicator reading boosts the euro, while a low one weakens the currency.
Previous values: -1.6% (+1.8 YoY) in January 2025, -0.6% (+2.5% YoY), -1,5% (+1,0% YoY), +1.2% (+3.8% YoY), +1.6 (+2.1% YoY), -1.2% (-0.6% YoY), +2.6% (-1.9% YoY), -1.5% (+2.2% YoY), -0.3% (-1.2% YoY) in January 2024.
The data suggests that the German economy’s recovery has been uneven, with some months experiencing a slowdown. Indicator readings higher than forecasted and/or previous values are likely positive for the euro in the short term.
13:00 – EUR: German Harmonized Index of Consumer Prices (Preliminary Estimate)
The Harmonized Index of Consumer Prices (HICP) is published by the European Statistics and is calculated using a methodology agreed upon by all EU countries. The HICP is an indicator for measuring inflation and is used by the European Central Bank to assess price stability. A positive index result strengthens the euro, while a negative one weakens it.
Previous values YoY: +2.8% in January 2025, +2.8% (December 2024), +2.4%, +2.4%, +1.8%, +2.0%, +2.6%, +2.5%, +2.8%, +2.4%, +2.3%, +2.7%, +3.1% in January 2024, +3.8% in December, +2.3% in November, +3.0% in October, +4.3% in September, +6.4% in August, +6.5% in July, +6.8% in June, +6.3% in May, +7.6% in April, +7.8% in March, +9.3% in February, +9,2% in January, +9.6% in December, +11.3% in November, +11.6% in October, +10.9% in September, +8.8% in August, +8.5% in July, +8.2% in June, +8.7% in May, +7.8% in April, +7.6% in March, +5.5% in February, +5.1% in January 2022.
The data suggests that German inflation continues to decelerate, albeit at a slower pace than expected. This situation is putting pressure on the European Central Bank to ease its monetary policy. Figures lower than the previous reading will likely affect the euro negatively. Conversely, the resumption of inflation growth may provoke the appreciation of the euro. The growth of the indicator values is a positive factor for the currency.
If the February data turns out to be better than previous values, the euro may strengthen in the short term.
13:30 – CAD: Canadian GDP. Canada’s Annual GDP Growth
The release of Canada’s GDP report by Statistics Canada significantly impacts the performance of the Canadian dollar. A positive report will bolster the Canadian dollar, while a weak GDP report will negatively affect the currency.
Canada’s quarterly GDP report reflects the total volume of all goods and services produced by Canada during the quarter (YoY) and is considered an indicator of the overall Canadian economy. GDP gained +0.3% (+1.0% YoY) in Q3 2024, following growth of +0.5% (+2.1% YoY) in Q2, +0.4% (+1.7% YoY) in Q1 2024, +0.2% (+1.0% YoY) in Q4 2023, a decline of -0.3% (-1.1% YoY) in Q3, -0.2% in Q2, +2.6% growth in Q1 2023, zero growth in Q4, +2.9% growth in Q3 2022, +3.3% in Q2 2022, +3.1% in Q1 2022 (YoY).
If the Q4 2024 data is better than the previous and/or forecasted value, the Canadian dollar will strengthen.
13:30 – USD: Personal Consumption Expenditures (Core PCE Price Index)
Personal Consumption Expenditures (PCE) data reflect the average amount of money consumers spend per month on durable goods, consumer goods, and services. The core PCE price index excludes food and energy prices. The annual core PCE is the main inflation gauge used by the US Fed as the primary inflation indicator.
The inflation rate, along with the labor market and GDP data, is crucial for the Fed in determining its monetary policy. Growing prices exert pressure on the central bank to tighten its policy and raise interest rates.
The PCE data above the forecasted and/or previous values may boost the US dollar, while a decline in the reading will likely exert a negative impact on the greenback.
Previous values YOY: +2.8% in December 2024, +2.8%, +2.8%, +2.7%, +2.7%, +2.6%, +2.6%, +2.6%, +2.8%, +2.8%, +2.8%, +2.9% in January 2024, +2.9%, +3.2%, +3.5%, +3.7%, +3.8%, +4.3%, +4.3% +4.7%, +4.8%, +4.8%, +4.7%, +4.7%, +4.6%, +4.8%, +5.1%, +5.2%, +4.9%, +4.7%, +4.8%, +4.7%, +4.9%, +5.2%, +5.3%, +5.2% in January 2022.
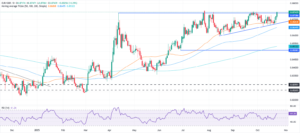
Price chart of EURUSD in real time mode
The content of this article reflects the author’s opinion and does not necessarily reflect the official position of LiteFinance broker. The material published on this page is provided for informational purposes only and should not be considered as the provision of investment advice for the purposes of Directive 2014/65/EU.
According to copyright law, this article is considered intellectual property, which includes a prohibition on copying and distributing it without consent.