Simple Moving Average (SMA): Formula, Trading Strategies & Examples


Although the stock price constantly changes and trading always involves uncertainty, technical analysis indicators help traders make better-informed decisions.
One of the most popular tools is the SMA (Simple Moving Average). Its signals are easy to read, and it is available on almost every trading platform, which makes it popular among both beginners and experienced technical traders.
The SMA indicator smooths out price fluctuations, shows market trends, and highlights potential reversal points. In this article, we will look at how to calculate SMA, its advantages and disadvantages, and how to use it for trading on Forex.
The article covers the following subjects:
Major Takeaways
- The Simple Moving Average (SMA) shows the average price of an asset over a specified period of time. It filters out unnecessary price noise and helps to identify the trend direction.
- There are different types of simple moving averages: short-term (fast), medium-term, and long-term (slow). Short-term SMAs react faster to price changes, while long-term SMAs better reflect the overall trend. The choice depends on your trading strategy and the results you want to achieve.
- A common SMA trading strategy is simple: buy when the price rises above the SMA, and sell when the price falls below it. Stop-loss orders are usually placed slightly below or above the SMA, depending on the trend.
- Another way to use the indicator is to track the crossover of two SMAs with different periods (when the fast SMA crosses the slow SMA and vice versa). SMA can also help identify support and resistance levels. In addition, you can combine SMA with other indicators to generate more reliable trading signals.
- The Simple Moving Average is an effective financial markets tool because it makes trend identification straightforward. However, it’s a lagging indicator, and its effectiveness is reduced in a flat market. Another point to consider is selecting the right time frame for each asset.
- The SMA indicator works well on time frames from H1 to D1. It is most effective on trending markets such as stocks, currency pairs, and commodities.
What Is SMA in Stock Market?
To make well-informed trading decisions, traders rely on technical analysis tools. One of the simplest and most widely used is the Simple Moving Average (SMA). It helps smooth out excessive price volatility, allowing traders to clearly see the overall trend direction.
SMA Full Form in Trading and Definition
The Simple Moving Average indicator (SMA) is one of the most straightforward indicators used by technical analysts. It smooths out price fluctuations over a chosen period by calculating the average closing price. This makes it easier to ignore short-term market noise and focus on the trend’s true direction.
The SMA indicator shows traders how the price is moving and helps identify approximate support and resistance levels. Additionally, it can highlight potential entry and exit points, typically when the moving average line crosses the price or another moving average. The higher the SMA period, the smoother the line becomes and the less it responds to minor fluctuations.
Why Is It Called a “Moving” Average?
The moving average gets its name from the fact that it is continually recalculated, moving in line with the price data. Each time a new data point appears, the oldest one is dropped from the calculation, keeping the average up to date at all times.
Imagine a window that constantly recalculates the average value. This makes it easier to see the overall trend by filtering out sudden spikes and showing the price direction. The word “moving” reflects the fact that the calculation keeps adjusting to new data.
Simple Moving Average Formula and How to Calculate It
The SMA formula calculates the weighted average price using historical data over a specified period of time. It takes all the closing prices for that period, adds them together, and divides the total by the number of periods. This helps traders separate short term fluctuations from the underlying price trend.
Step-by-Step SMA Calculation Process
The Simple Moving Average (SMA) is the average price of an asset over a selected period. The period can vary, but the most common choices are 5, 10, 20, 50, 100, or 200.
The formula for calculating the SMA is straightforward. Take a time period n and calculate:
Where:
P₁, P₂, …, Pₙ are the closing prices of the asset for each of the periods.
n is the number of periods used in the calculation.
Simple Moving Average Example with Real Numbers
Let’s say we need to find the 10-day moving average for AT&T stock.
Here are the past closing prices for the last 10 days:
- Day 1: $26.93;
- Day 2: $26.96;
- Day 3: $26.92;
- Day 4: $26.92;
- Day 5: $26.95;
- Day 6: $27.37;
- Day 7: $27.51;
- Day 8: $27.53;
- Day 9: $27.55;
- Day 10: $27.46.
Add up all the prices and divide by 10:
($26.93 + $26.96 + $26.92 + $26.92 + $26.95 + $27.37 + $27.51 + $27.53 + $27.55 + $27.46) / 10 = $272.1 / 10 = $27.21
Thus, the 10-day moving average is $27.21, reflecting the security’s price past performance during this period.
How SMA Indicator Works in Technical Analysis
SMA (Simple Moving Average) in technical analysis helps traders understand market movements. In this section, we will examine how it can be used exactly.
Trend Identification
By analyzing the price movement in relation to the SMA, traders can determine whether the trend is bullish or bearish.
In an upward trend, the price usually stays above the moving average, and the SMA itself points upward. This means that buyers have more power than sellers. In a downward trend, the price remains below the SMA, and the moving average line slopes downward.
Traders often use several SMAs with varying periods to confirm the trend and get clearer trading signals. For example, if a short term sma crosses a long term sma from below, it may indicate the start of a bullish trend. If the opposite happens, a downtrend is more likely.
Support and Resistance Levels
The SMA can also indicate potential support and resistance levels. When the price remains below the SMA for a long time, the trend is likely bearish. In this case, the SMA acts as a dynamic resistance line that moves along with the price.
Conversely, if the price consistently stays above the SMA, it signals growth. Here, the SMA often serves as a support line.
Longer term moving averages (such as 50-day or 200-day) are usually considered more significant support and resistance levels than shorter SMAs. This is because they reflect longer-term price trends and the views of a larger number of market participants.
Popular SMA Periods and Their Trading Applications
Choosing the right SMA period is crucial for identifying trends and building an effective trading strategy. The most common periods are 20, 50, 100, or 200. Shorter periods are used to determine shorter term trends, while longer ones help identify a long term trend.
Short-Term SMA
A short-term SMA reflects the average price of an asset over the past 5, 10, or 20 days and is widely used by short term traders. It helps traders quickly see where the price is heading and identify entry and exit points.
The key idea is simple: when a short period sma crosses a longer one, it often signals a trend change. If the short-term SMA crosses above the long-term SMA, it suggests buying opportunities. If it crosses below, it suggests selling.
Keep in mind that short-term SMAs react very quickly to price action. When the market is volatile, they can generate many false signals.
Medium-Term SMA
A medium-term SMA is typically calculated over 50 or 100 days. In trading, it is used to identify an intermediate trend and potential support and resistance levels. When the price crosses the SMA, it can be a signal to open a position.
However, there is a nuance: the SMA lags behind the price and does not react immediately. For more accurate signals, traders need to choose the right calculation period.
Long-Term SMA
Long-term SMAs are calculated over longer periods, such as 100 or 200 days. They help identify the broader market trend and are often used by long term investors. When the price crosses a long-term SMA, it often signals a good trading opportunity. For example, if the price breaks through the SMA from below, it may indicate the start of an uptrend.
The main advantage of long-term SMAs is that their smoothing factor filters out market noise and shows the bigger picture. The downside is that they react slowly to sudden price changes.
SMA Trading Strategies and Signal Generation
SMA trading strategies are quite popular among traders. They help determine the market direction and identify profitable entry and exit points.
Price Crossover Strategy
The crossover of price and the Simple Moving Average (SMA) is one of the most common and straightforward strategies. If the price breaks above the SMA from below, it may be a good opportunity to go long, as this often signals the start of an uptrend. If the price crosses the SMA from above, it usually indicates the beginning of a downtrend and gives a bearish signal.
To improve the accuracy of this strategy, traders often combine the SMA with trading volume, RSI, or MACD. These tools help confirm the signals. It’s also important to consider the overall market environment and keep track of news, as both can influence price movements.
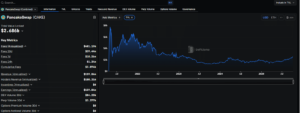
Below is an example of using the Simple Moving Average in trading Pfizer Inc stock.
The chart shows key support and resistance levels. Two scenarios are possible:
1. Long scenario
- The price breaks above the short-term SMA20 near $22.20, signaling a buying opportunity.
- In this case, a stop-loss order should be placed just below the SMA at the support level of $21.66.
- Take-profit is set at the nearest resistance level of $24.46. In our example, the price reaches the previous consolidation zone of the asset.
2. Short scenario
- From the resistance level of $24.46, the price reverses downward and breaks below the SMA20 with a strong bearish candle near $23.40, which acts as a sell signal.
- A stop-loss order should be placed just above the SMA at $23.62.
- Take-profit is set at the nearest support level of $21.89.
SMA Crossover Strategy
This moving average crossover strategy is quite simple: use two moving averages (SMAs) with different periods — one shorter and one longer. The short SMA reacts more quickly to price changes, while the long period SMA reflects the overall trend by smoothing out fluctuations.
When the short SMA crosses the long SMA from below, it generates a bullish signal, suggesting a potential uptrend. When the short SMA crosses the long SMA from above, it gives a sell signal.
For this strategy to work effectively, it’s important to select the right SMA periods, as they will vary depending on the market and time frame. It is also helpful to confirm trading signals with support and resistance levels, as well as trading volumes. Of course, SMA crossovers don’t guarantee 100% accuracy, but when applied correctly, they can generate solid profits.
Let’s look at an example of using the Simple Moving Average with Nike Inc. stock.
1. Long setup
- The price bounces upward from the $89.46 level after a prolonged decline and breaks above both the short-term and long-term SMAs. A bit later, the short-term SMA50 crosses the long-term SMA200 from below near $103.88, forming the Golden Cross pattern. This serves as a signal to open long positions with potential targets at $111.81, $116.02, $123.30, and $128.31.
- In this case, a stop-loss order is better placed below the Golden Cross, around $101.30.
2. Short setup
- The price reverses downward from the resistance level of $123.30, forming a gap to the downside. Soon after, the Death Cross pattern appears below $103.88, as the short-term SMA crosses the long-term SMA from above. This gives a sell signal with potential targets at $99.18, $94.01, $91.64, $89.46, and $83.03.
- In this case, a stop-loss order should be placed above the Death Cross, near $108.38.
Advantages and Limitations of Simple Moving Average
Like any technical indicator, the SMA has its advantages and disadvantages.
Key Benefits of SMA Indicator
- Easy to figure out and calculate.
- Smooths out price movements and helps identify the main trend.
- Makes it possible to determine trend direction.
- Generates buy and sell trading signals when the price crosses the SMA line.
Common Limitations and Drawbacks
- Lagging signals. The moving average lags behind price changes, especially when using longer periods. This occurs because the simple moving average formula calculates the average over the entire selected time period, not just the most recent data.
- All data points have equal weight, without considering the significance of recent data points. As a result, the SMA may react more slowly to new developments.
- At times, the SMA produces false signals, especially during periods of high volatility.
How to Minimize SMA Weaknesses
Use the SMA together with other tools.
- For example, RSI can help confirm signals and reduce the risk of false entries.
- Adjust the SMA period to the market: the faster the market moves, the shorter the period should be. Keep in mind that shorter periods may generate more false signals.
- Experiment with different settings to find the optimal setup for your chosen assets.
- Watch trading volumes during SMA crossovers, as this helps assess the strength of the trend.
Risk Management with SMA
When trading with the SMA, it’s important to remember risk management.
- Since the SMA reacts with a lag, relying on it alone can cause traders to miss good opportunities. To avoid this, it’s better to combine the SMA with fundamental analysis tools and other indicators, such as RSI or MACD, to confirm signals.
- It’s also essential to choose the right SMA period, depending on the market situation and your trading goals. Longer periods produce more reliable signals, but with a greater delay.
- And above all, always use stop-loss orders to limit potential losses.
Conclusion
The SMA, or Simple Moving Average, remains a fundamental tool in a trader’s toolkit.
The SMA formula smooths out price fluctuations and helps reveal underlying price trends. By tracking SMA crossovers with price or with other moving averages, traders can build effective SMA strategies for both short-term and long-term trading.
Despite its simplicity, the SMA provides valuable signals for making informed trading decisions and remains a relevant tool in investment research and technical analysis. Try the SMA indicator on a free LiteFinance demo account to improve your trading strategy!
Get access to a demo account on an easy-to-use Forex platform without registration
Go to Demo Account
The content of this article reflects the author’s opinion and does not necessarily reflect the official position of LiteFinance broker. The material published on this page is provided for informational purposes only and should not be considered as the provision of investment advice for the purposes of Directive 2014/65/EU.
According to copyright law, this article is considered intellectual property, which includes a prohibition on copying and distributing it without consent.