SOL USD Technical Analysis For The End of September
SOL USD Technical Analysis is one to behold. As we will see on the charts below, it is quite unpredictable and volatile. But as ETFs are yet to be approved, it seems like believers in the blockchain are accumulating the coin. What are people supposed to look for when it comes to price, if they want to buy? Follow along and find out!
Reclaim $204 and I believe the low is in
Choose your stop loss
Target: $260https://t.co/Xj9fw2W3zc no kyc needed pic.twitter.com/boQGxYhgES
— Daink (@TraderDaink) September 27, 2025
TraderDaink is one of the many traders who has a position on SOL. He is currently in profit and believes we have more upward momentum ahead. Daink is a seasoned, profitable trader, and this is not his first rodeo.
DISCOVER: 9+ Best Memecoin to Buy in 2025
SOL USD Technical Analysis Insights For October
(Source – TradingView, SOLUSD)
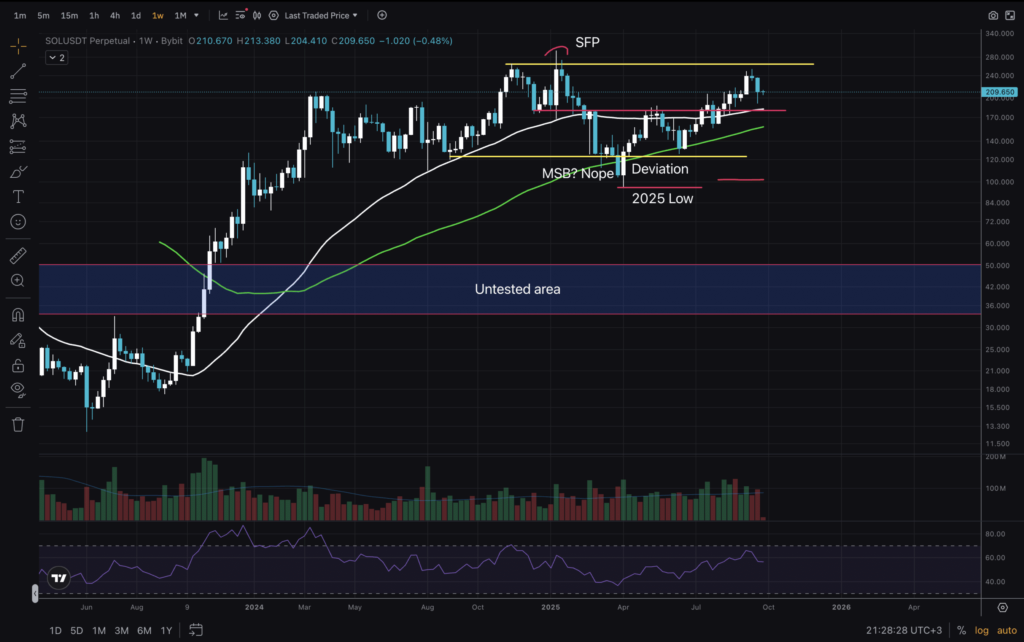
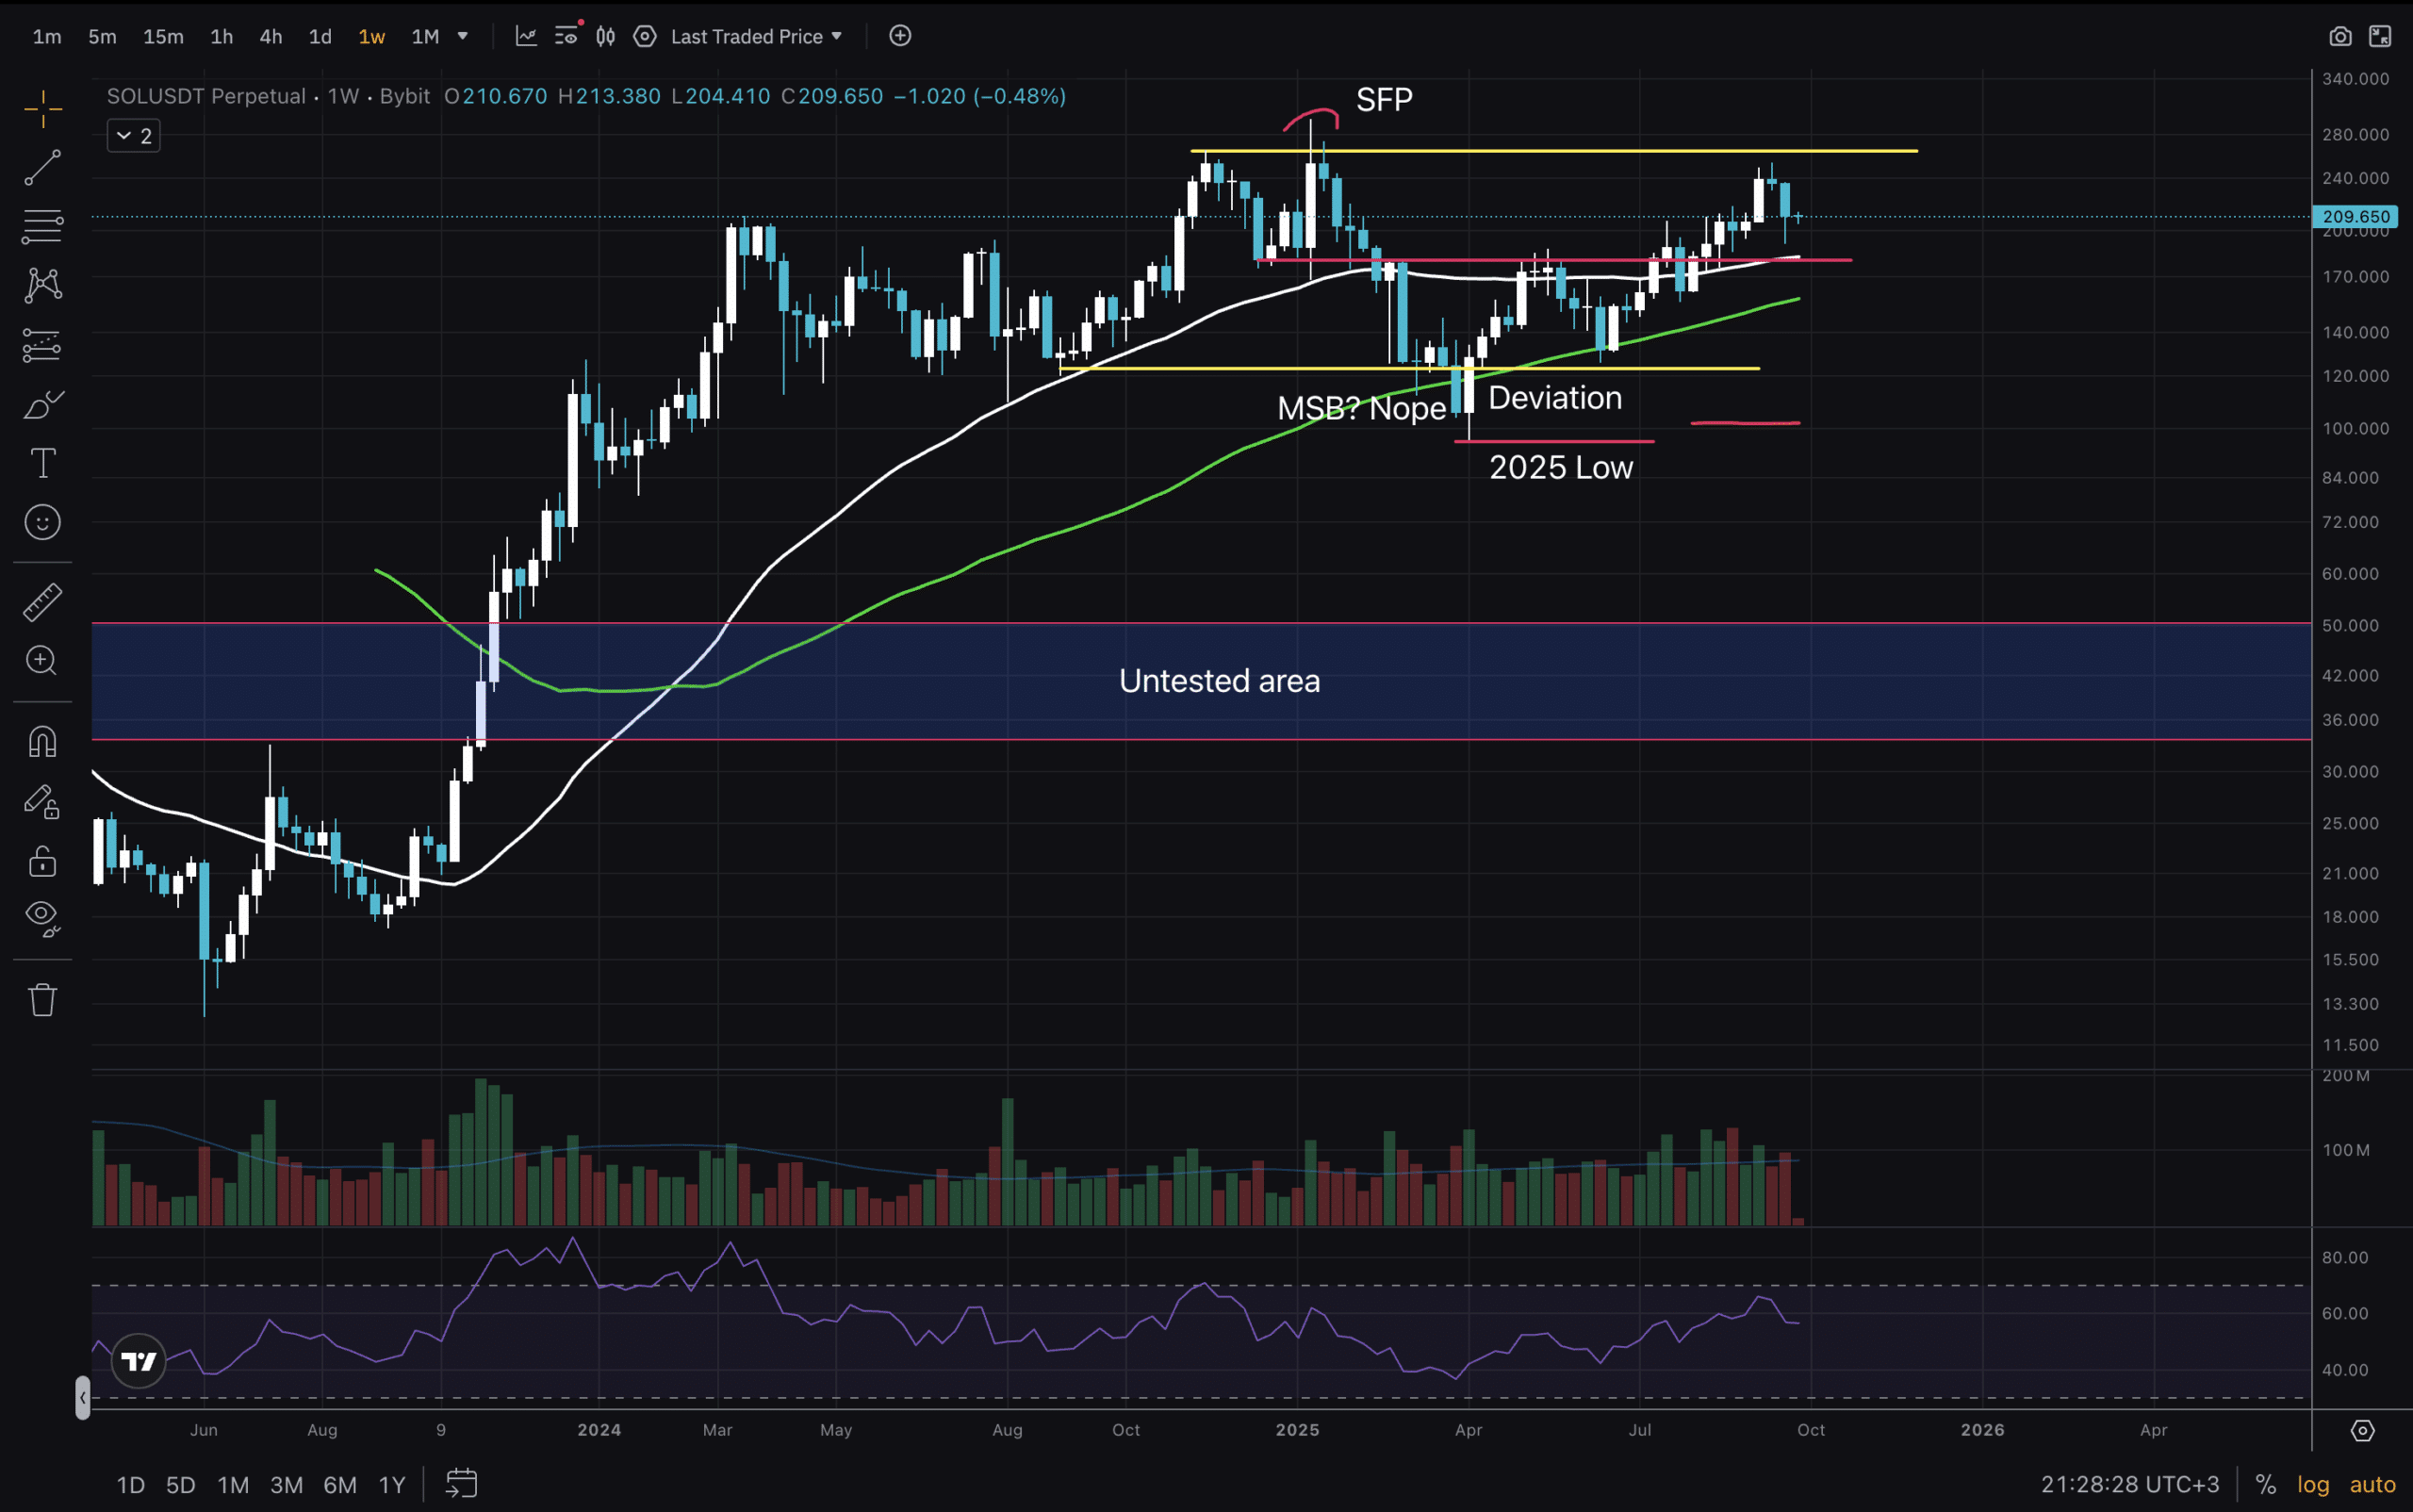
Starting today’s analysis with the 1W chart, we can see an untested area between $35-50 on SOL. But price has spent almost 2 full years in the upper range, and it seems unlikely that it will retrace so far down.
There was this MSB suggestion for the Spring of 2025, which turned out to be a standard Deviation. Price is currently in an uptrend, making higher highs and higher lows. Also trading above all Moving Averages.
DISCOVER: 16+ New and Upcoming Binance Listings in 2025
(Source – TradingView, SOLUSD)
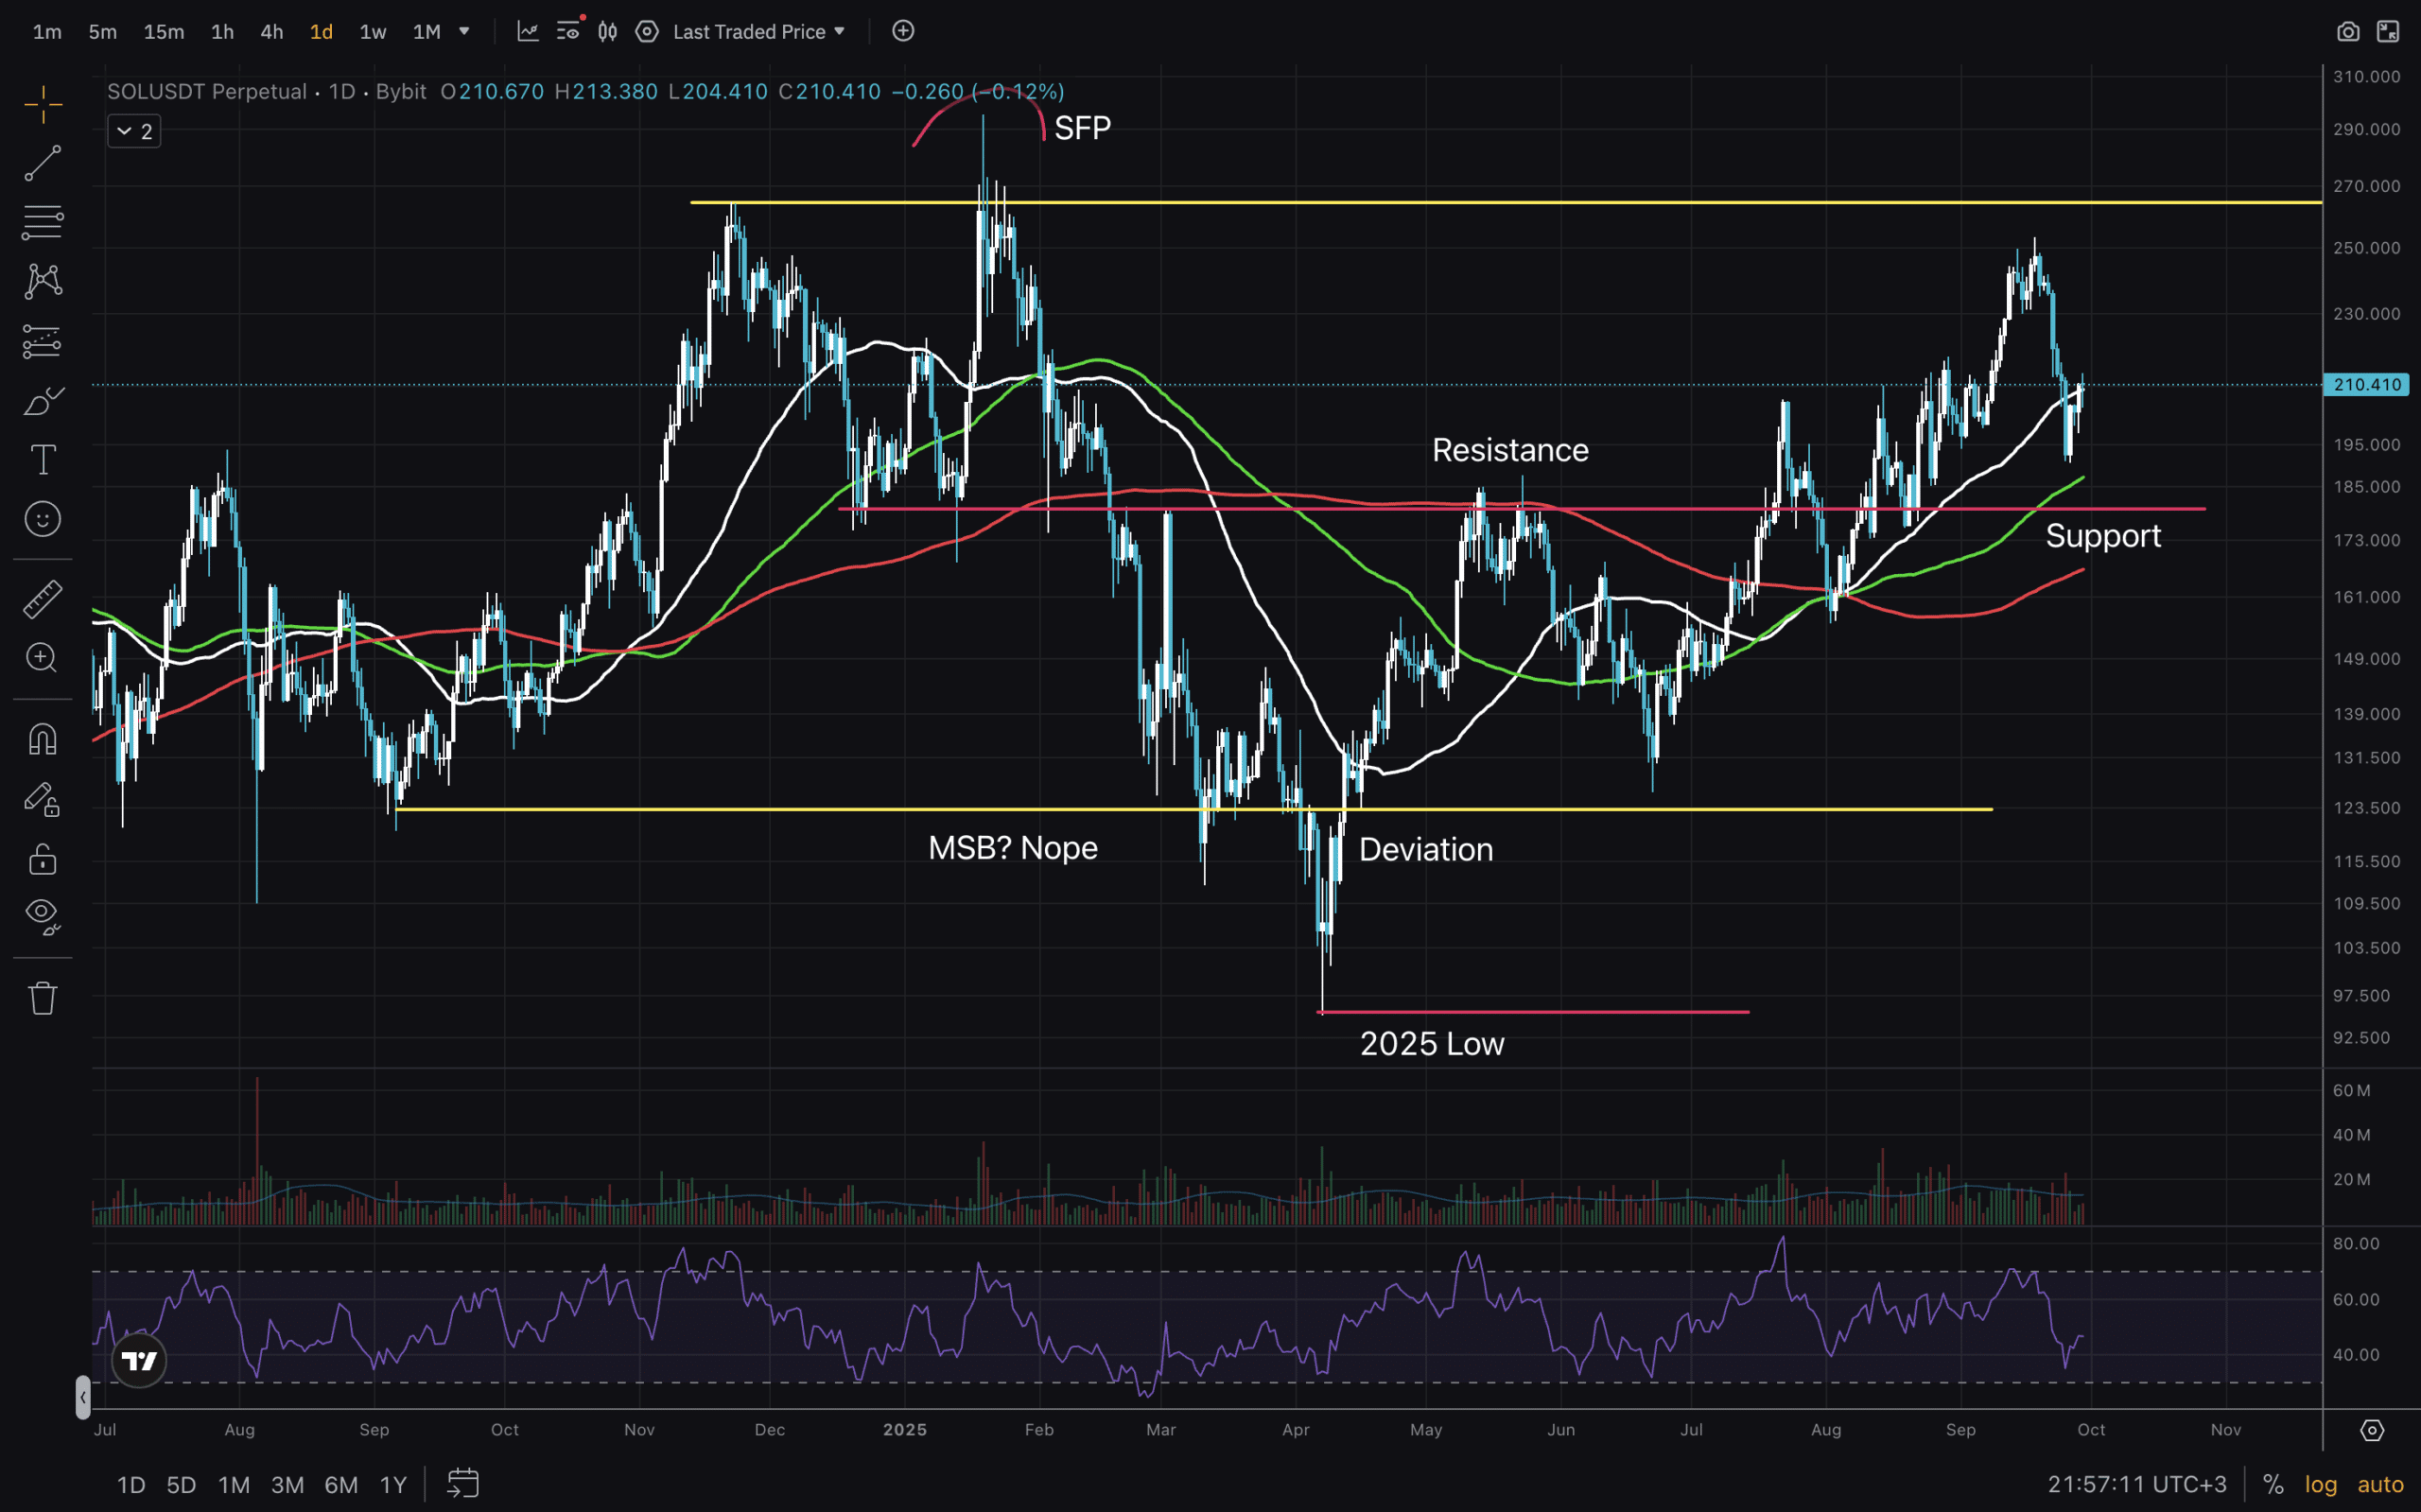
On the 1D chart, there is a lot! Beautiful for the eyes of technical analysts – potentially confusing for novice traders. Let’s break it down.
Our 2025 high is just under $270 and is the top of the range. Around $123 is the bottom yellow line – that is the 2024 support and the bottom of the range. Price is trading above all Moving Averages here too – indicating the uptrend, higher highs and higher lows too. SOL has flipped the $180 resistance level into support in the second half of 2025.
DISCOVER: 15+ Upcoming Coinbase Listings to Watch in 2025
H4 Timeframe Chart and Conclusions
(Source – TradingView, SOLUSD)
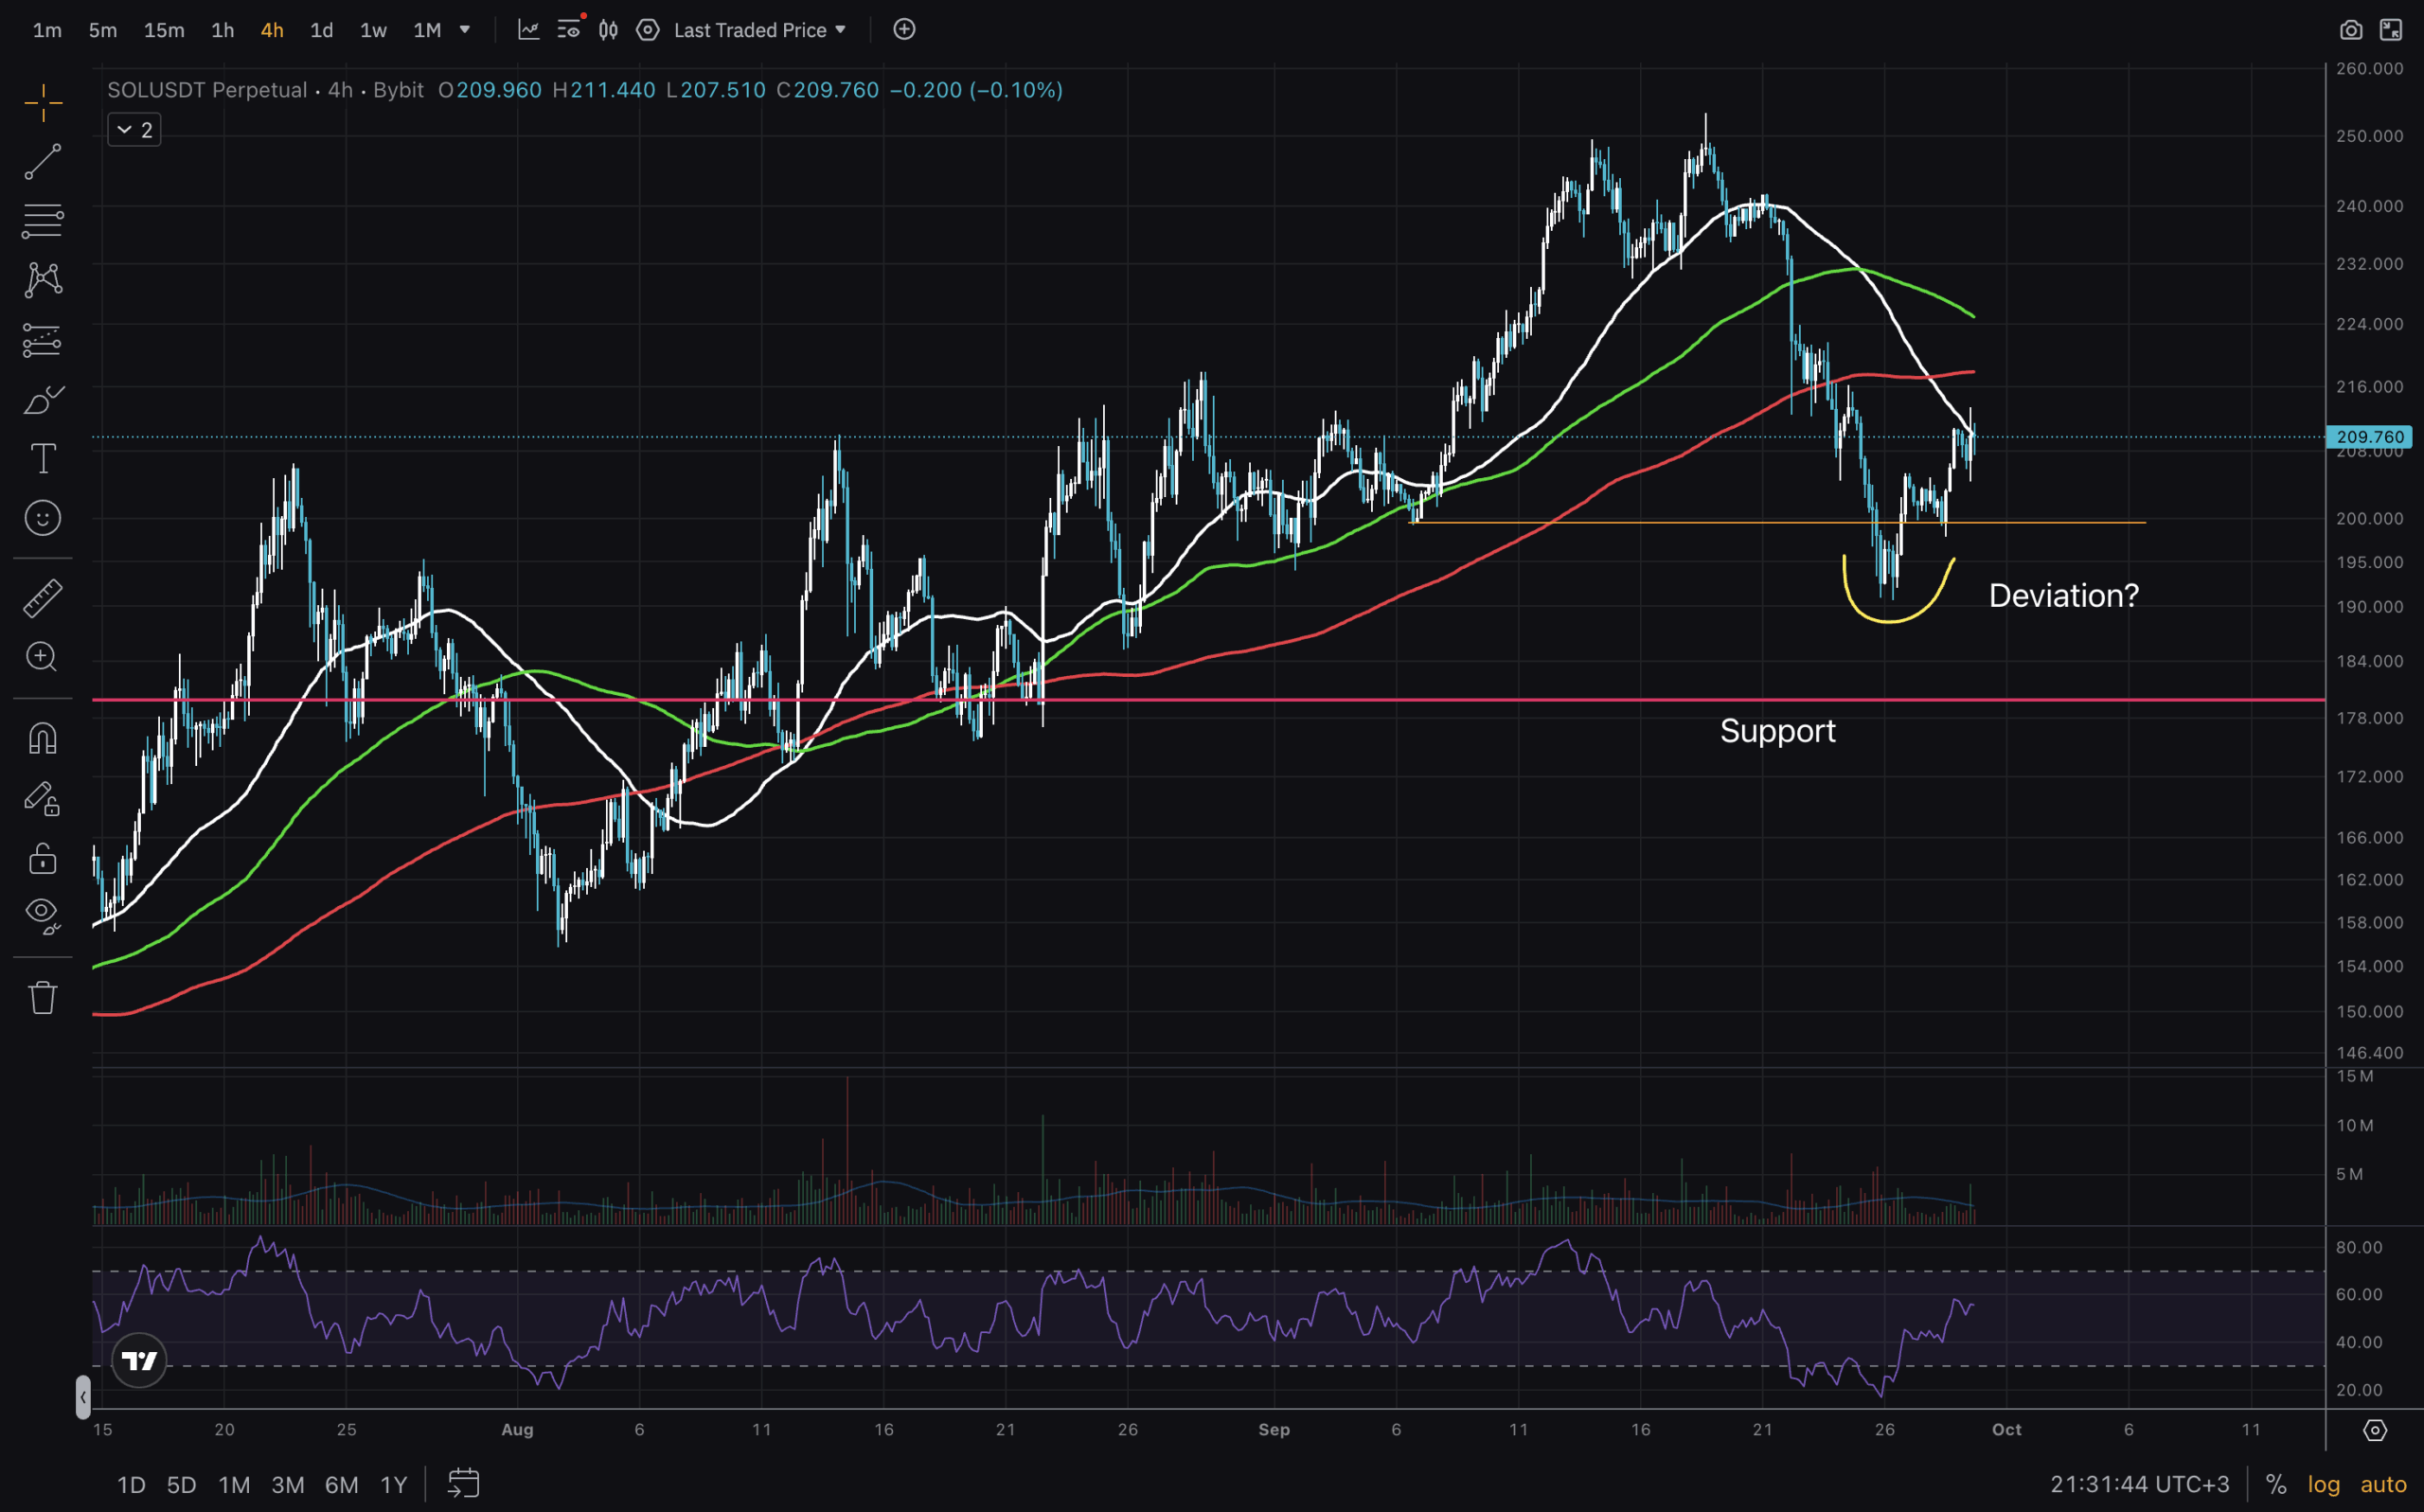
For the final and most zoomed-in analysis, we will look at the 4H chart. $200 level looks like a key one here, as price broke under for a short time and has recently reclaimed that level. All Moving Averages are above, which we want to see reverse for price to move up to $250 and beyond. It is potentially a good place for longs with a stop down at $190. It’ll give 1.5R at $250 and much more at the new ATH. Let’s track and see what happens next week!
DISCOVER: 10+ Next Crypto to 100X In 2025
Join The 99Bitcoins News Discord Here For The Latest Market Updates
SOL USD Technical Analysis For The End of September
- Key level to hold is $180, though price might stay above $200
- RSI has room for growth on all timeframes
- Expect price volatility around Monthly close
- Need to reclaim the MAs on 4H for further upside
- Uptrend Market Structure identified by higher highs and higher lows
The post SOL USD Technical Analysis For The End of September appeared first on 99Bitcoins.